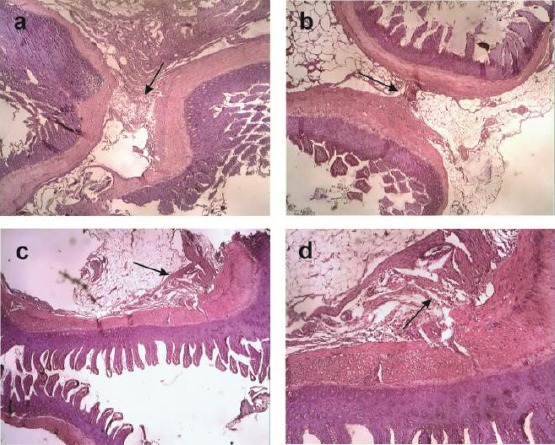
Figure 3.

Microscopic appearance showed the severe peritoneal adhesion in A) the Sham and B) Control group respectively 3,4 ± 0,89 and 4.0 ± 0,00 with thicker connective tissue (Black arrow) while in C) the T1 groups showed no peritoneal adhesion (0,0 ± 0,00) and D) T2 groups was less peritoneal adhesion (0,2 ± 0,44) with weak connective tissue (black arrow) (magnification 10 X)
