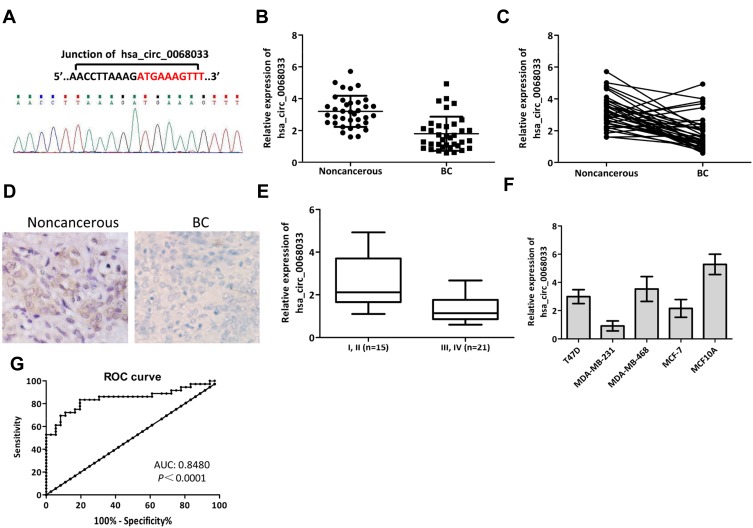
Figure 1.
Expression of hsa_circ_0068033 in BC tissues and cell lines. (A) The back-spliced junction of hsa_circ_0068033 confirmed by Sanger sequencing. (B, C) The qRT-PCR results showed that hsa_circ_0068033 was downregulated in BC tissues (n=36) compared with adjacent noncancerous tissues (n=36), and U6 was utilized as an internal gene. (D) ISH showed positive expression of hsa_circ_0068033 in adjacent noncancerous tissues, and negative expression in BC tissues (n=3). (E) The levels of hsa_circ_0068033 were lower in stage III and IV BC patients versus stage I and II patients. (F) The qRT-PCR analysis showed that hsa_circ_0068033 was downregulated in BC cell lines. (G) The plotted ROC curve of hsa_circ_0068033 in confirming BC (AUC=0.8480, P<0.0001).

