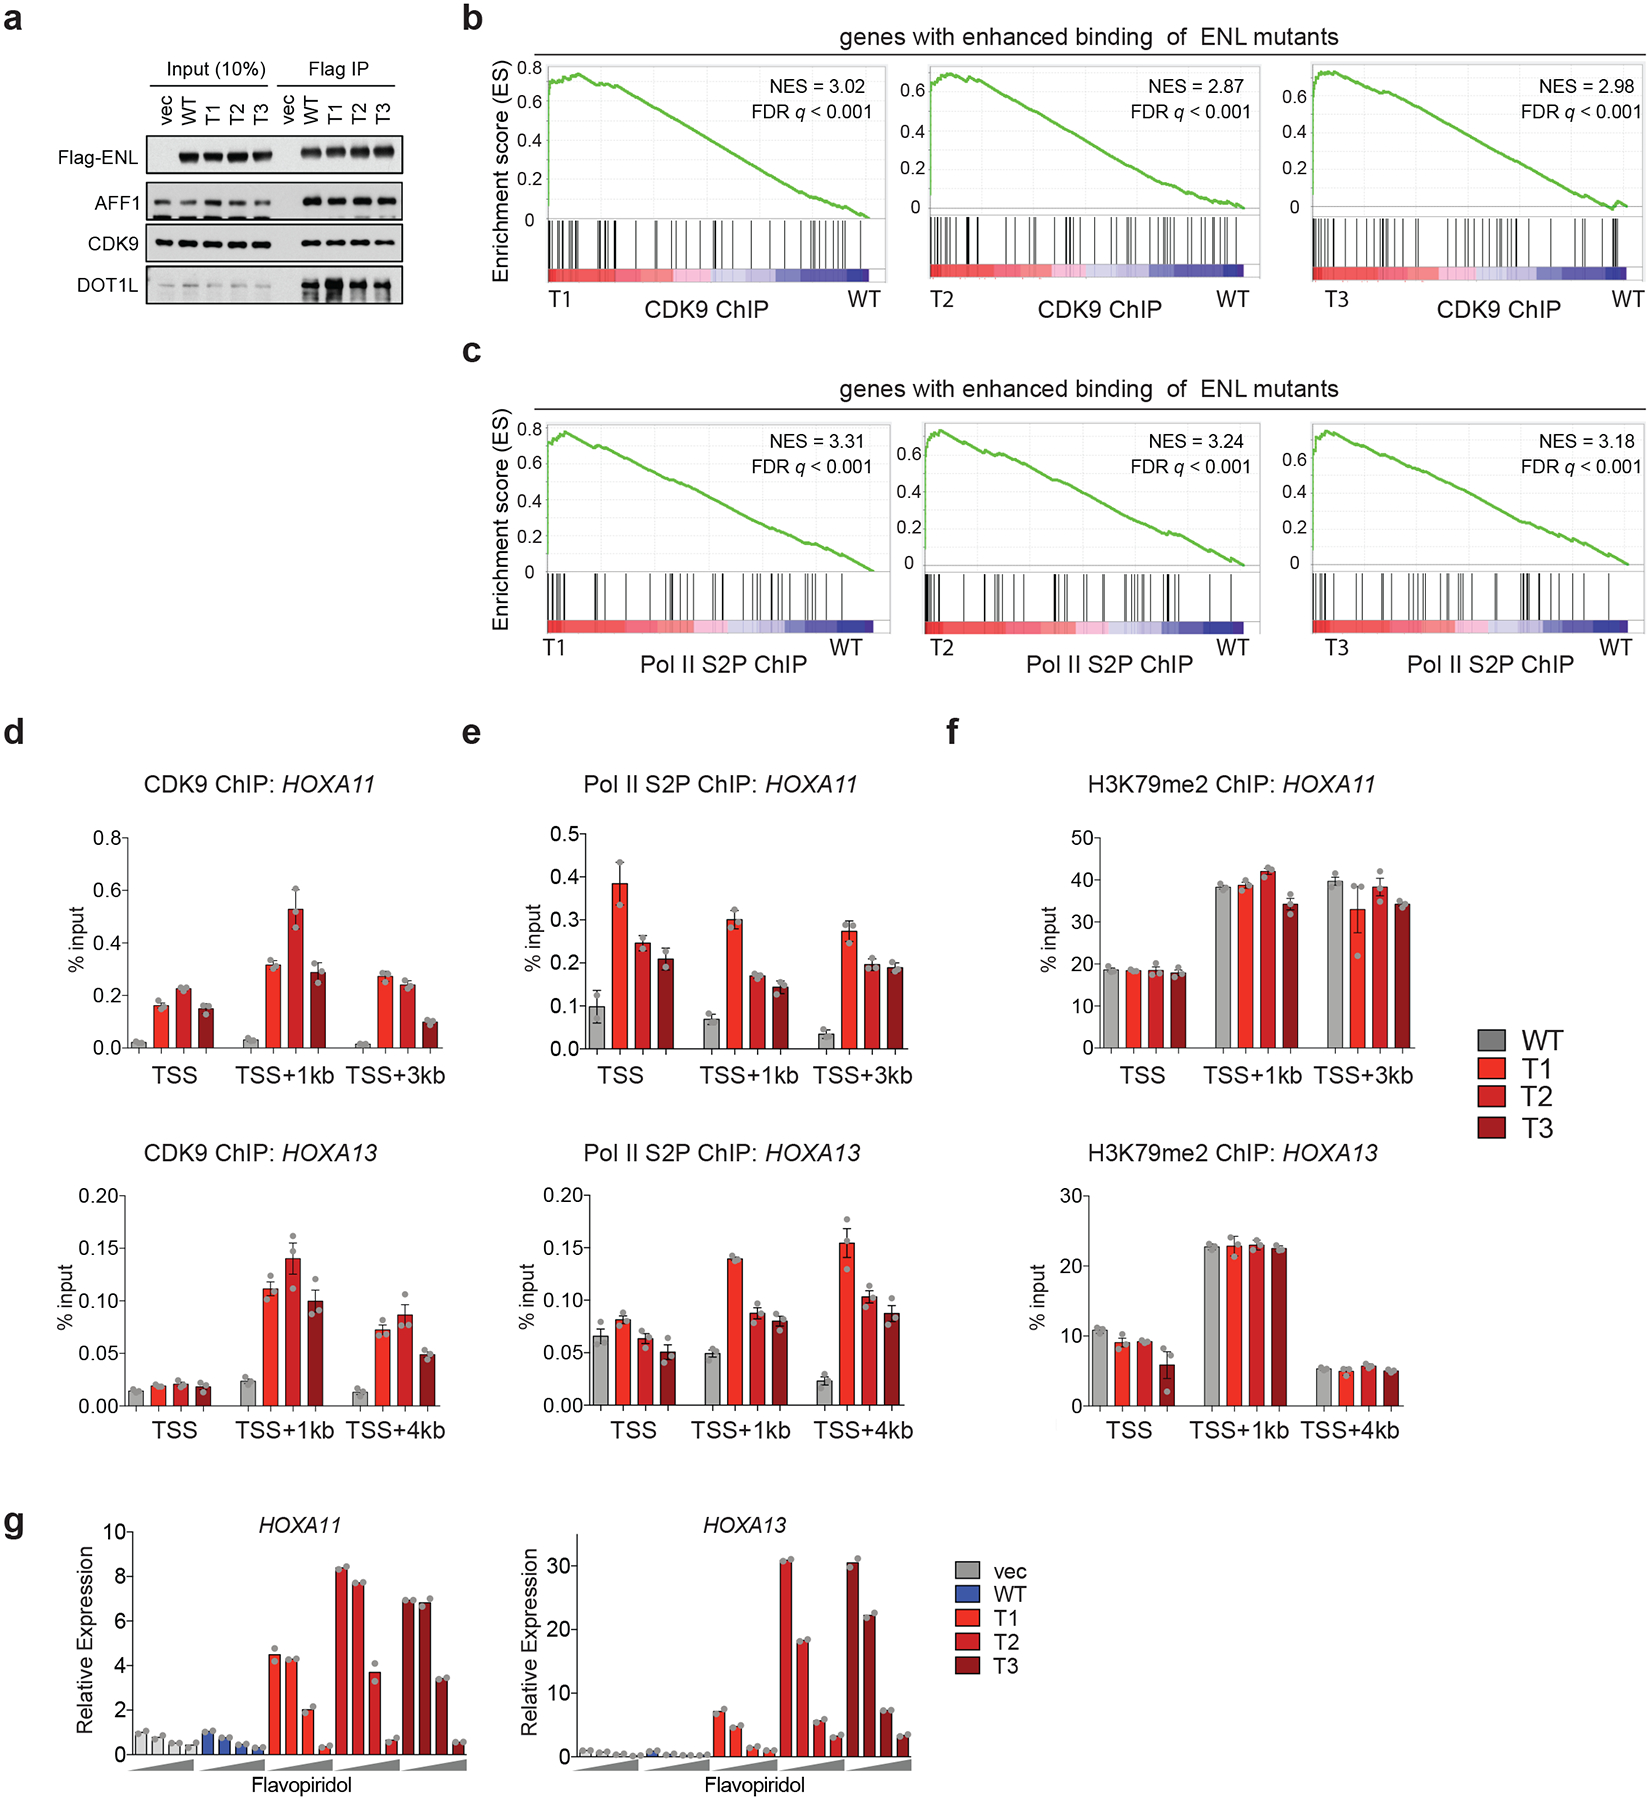
Extended Data Fig. 6 |. Enhanced binding of ENL mutants at target genes leads to increased SEC recruitment and activity.

a, Western blot analysis of co-immunoprecipitation (IP) using the M2 anti-Flag antibody with lysates from HEK293T cells that are expressing the indicated Flag–ENL constructs. The experiment was repeated twice with similar results. For source data, see Supplementary Fig. 1. b, c, GSEA plots of genes ranked by their fold-change (mutant over WT) of CDK9 (b) or Pol II S2P (c) ChIP–seq signals in HEK293 cells, annotated against the set of genes (n = 87) that show increased occupancy of ENL mutants compared with WT. d-f, ChIP-qPCR analysis of CDK9 (d), Pol II S2P (e) and H3K79me2 (f; dimethylation of lysine 79 of histone H3) at selected ENL target genes in HEK293 cells that are expressing the indicated Flag–ENL constructs. Data represent means ± s.e.m.; n = 3 technical replicates. Experiments were repeated twice with similar results. g, mRNA expression analysis (normalized to GAPDH) of selected ENL target genes in HK-2 cells expressing the indicated constructs upon treatment with flavopiridol for 3 h. Increasing dosages (0, 125 nM, 250 nM and 1,000 nM) are depicted by grey wedges. Data represent means from n = 2 technical replicates. Experiments were repeated twice with similar results.
