
Extended Data Fig. 9 |. Characterization of nuclear puncta formed by ectopically expressed ENL tumour mutants.
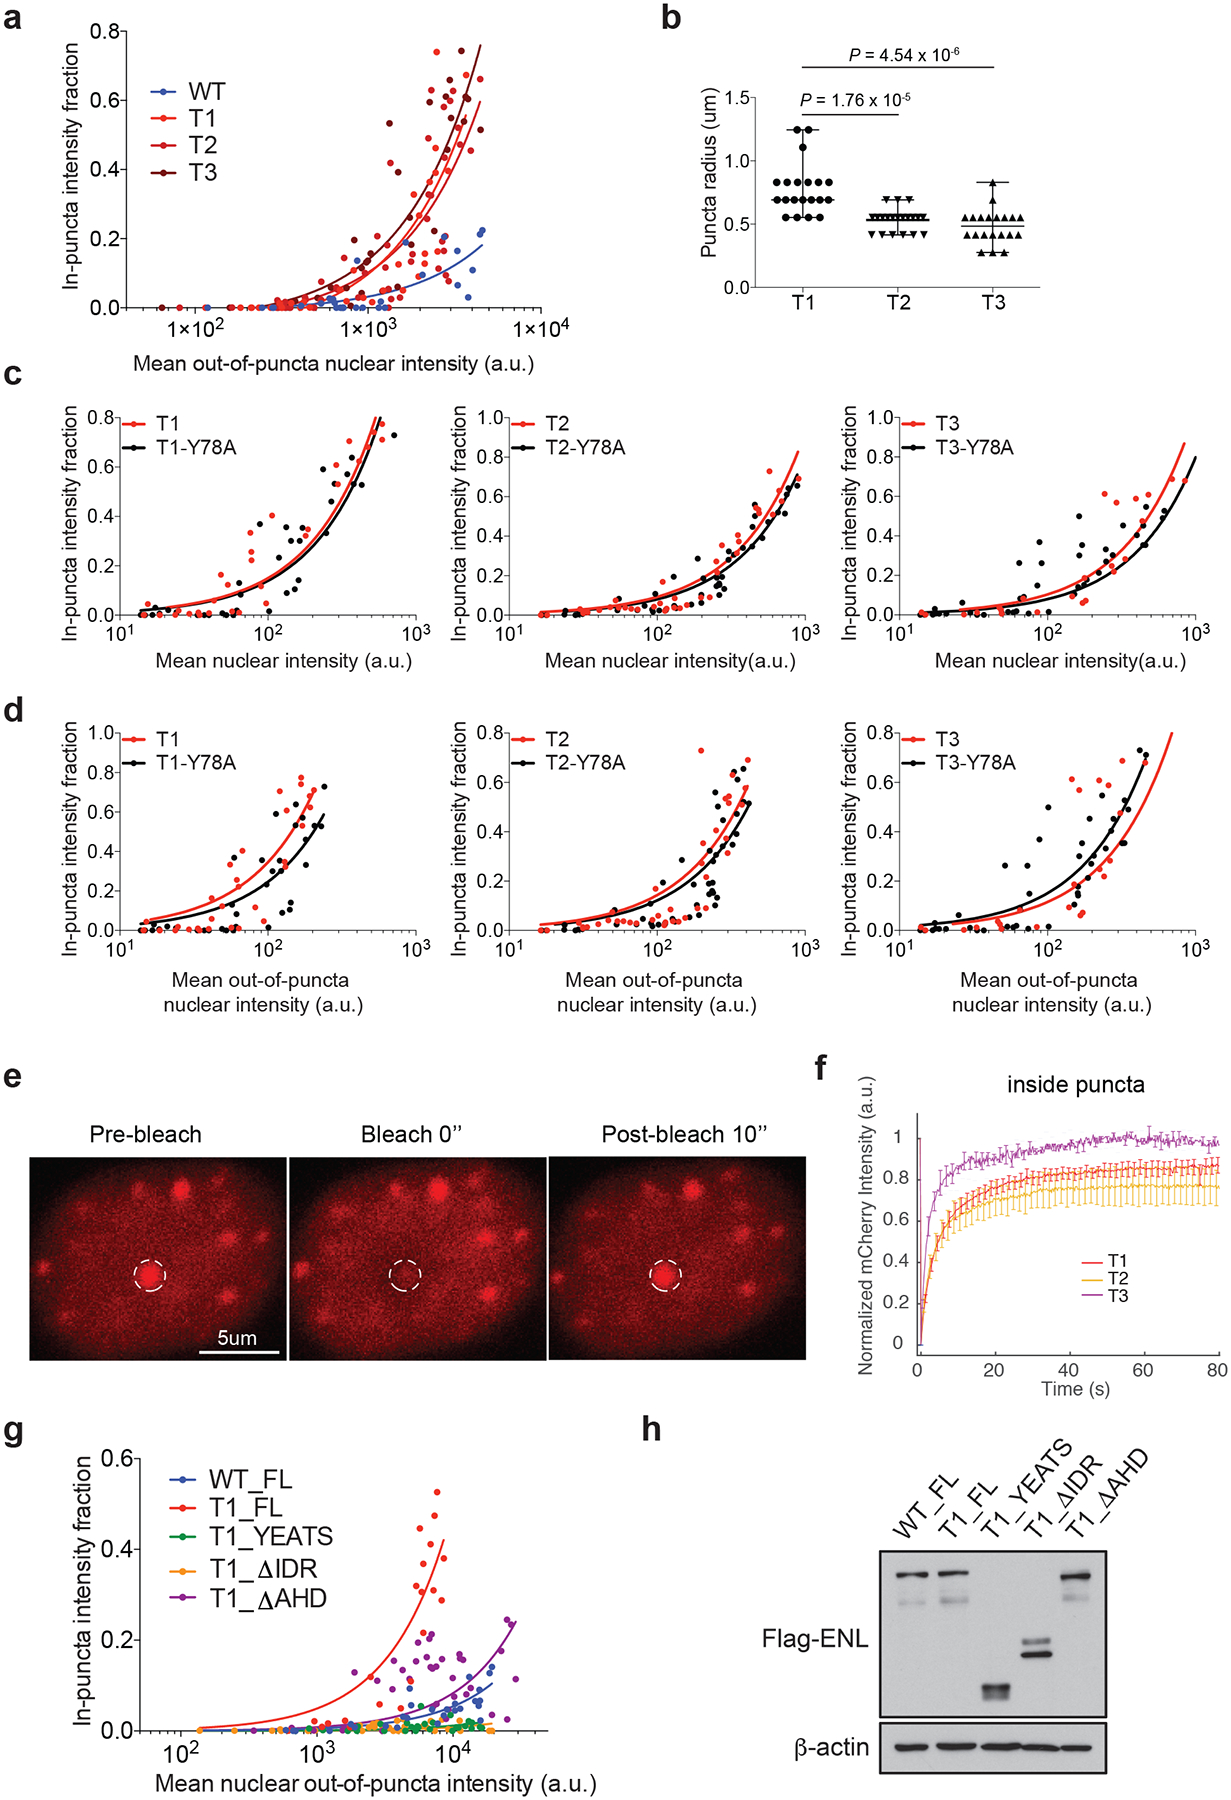
a, Fraction of in-puncta fluorescence intensity in the nucleus of HEK293 cells that express WT or mutant mCherry–ENL, as a function of mean out-of-puncta nuclear intensity. Each dot represents one cell (the same experiment as in Fig. 4e). b, Dot plots showing the radius of puncta in HEK293 cells that are expressing similar levels of the indicated mCherry–ENL proteins. n = 20 independent puncta, randomly selected from four different cells per group. P-values were obtained using two-tailed unpaired Student’s t-test. Centre lines represent medians; whiskers indicate the minimum to maximum range. c, d, Fraction of in-puncta mCherry–ENL intensity in the nucleus as a function of mean nuclear intensity (c) or mean out-of-puncta nuclear intensity (d) in HEK293 cells that express the indicated mCherry–ENL proteins. Each dot represents one cell. e, Representative images from fluorescence recovery after photobleaching (FRAP) analysis in HEK293 cells expressing T3 mutant mCherry–ENL. The white dashed circles indicate the punctum undergoing targeted bleaching. Images represent 14 FRAP experiments in total with T1/2/3 mCherry–ENL. f, Averaged FRAP curves from areas inside the mCherry–ENL puncta formed by the indicated ENL mutants. Bleaching occurs at t = 0 s. Data represent means ± s.e.m.; n = 6 (T1), 5 (T2) and 3 (T3) distinct puncta from multiple cells. g, Fraction of in-puncta fluorescence intensity in the nucleus of HEK293 cells that express the indicated mCherry–ENL constructs as a function of mean nuclear out-of-puncta intensity. Each dot represents one cell (same experiment as in Fig. 4g). h, Western blot showing the protein levels of ectopically expressed Flag–ENL in HEK293 cells. Experiments were repeated three times with similar results. For gel source data, see Supplementary Fig. 1.