
Fig. 2 |. ENL mutations enhance chromatin occupancy by ENL and associated SEC complex to enforce active transcription.
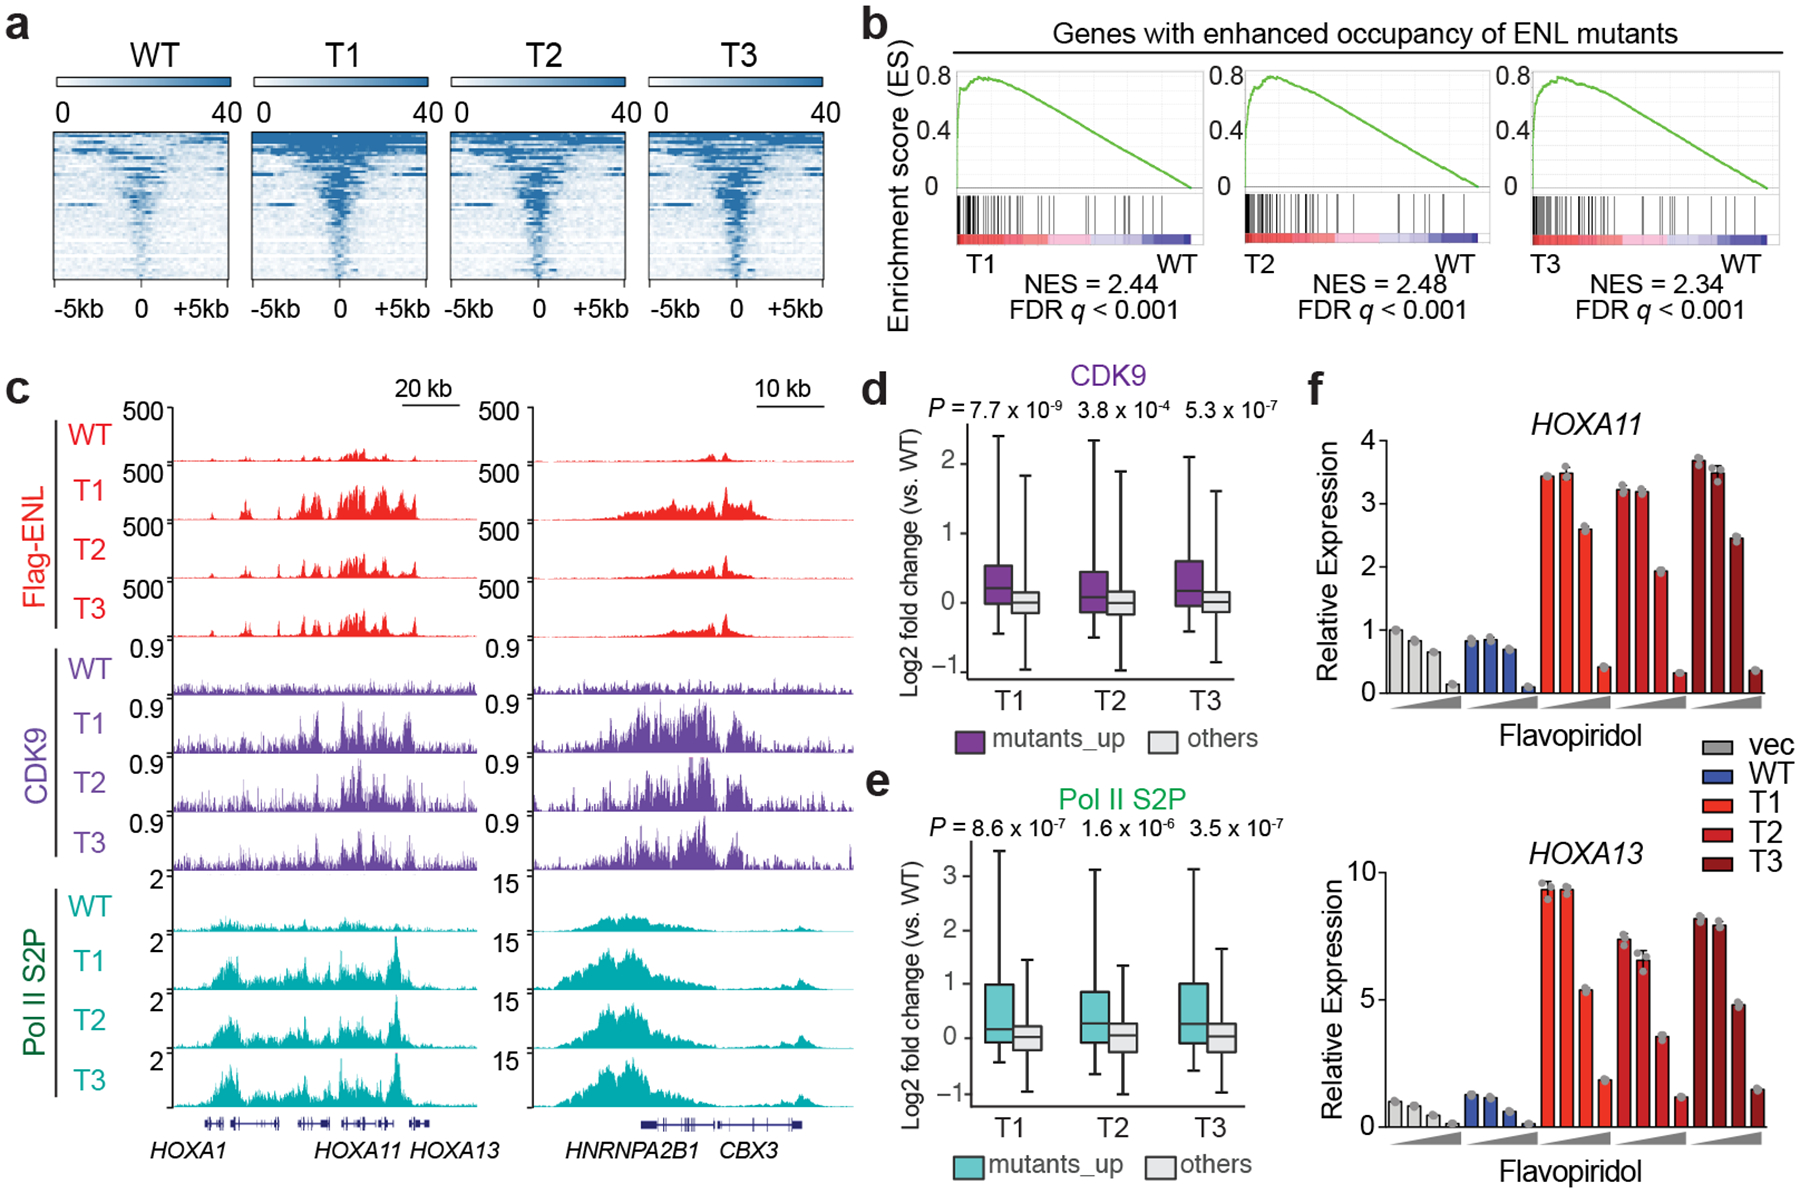
a, Heat map representation of ENL-bound chromatin peaks that show increased occupancy by T1, T 2 and T3 mutants compared with WT ENL (n = 54; Supplementary Table 6) in HEK293 cells. These heat maps are centred on ENL-bound peaks across a ±5-kb window. The colour key represents the signal density, with darker colour representing a more intense signal. b, GSEA plots showing that genes (n = 87; Supplementary Table 10) with enhanced occupancy by ENL mutants are upregulated in mutant-expressing HEK293 cells. c, Genome browser view of Flag–ENL, CDK9 and Pol II phosphorylated serine 2 (S2P) ChIP–seq signals at selected ENL target genes in HEK293 cells. d, e, Box plots showing log2 fold changes (T mutants versus WT) in CDK9 (d) or Pol II S2P (e) ChIP–seq signals at genes that have enhanced binding of ENL mutants (mutants_up, n = 87; Supplementary Table 10) and at the other genes in the genome (others) in H EK293 cells. The indicated P-values were obtained by one-sided Wilcoxon signed-rank tests. For box plots, the centre lines represent the median; the box limits are the 25th and 75th percentiles; and the whiskers show the minimum to maximum values. f, Analysis of messenger RNA expression (normalized to GAPDH expression) from the indicated ENL-target genes in HEK293 cells that express the indicated ENL or vector constructs upon treatment with flavopiridol for 3 h. Increasing dosages (0, 10 nM, 100 nM and 1,000 nM) are depicted by grey wedge. Means ± s.e.m., n = 3 technical replicates. Data represent two independent experiments.