
Extended Data Fig. 2 |. Three-dimensional nephron structures derived from mESCs.
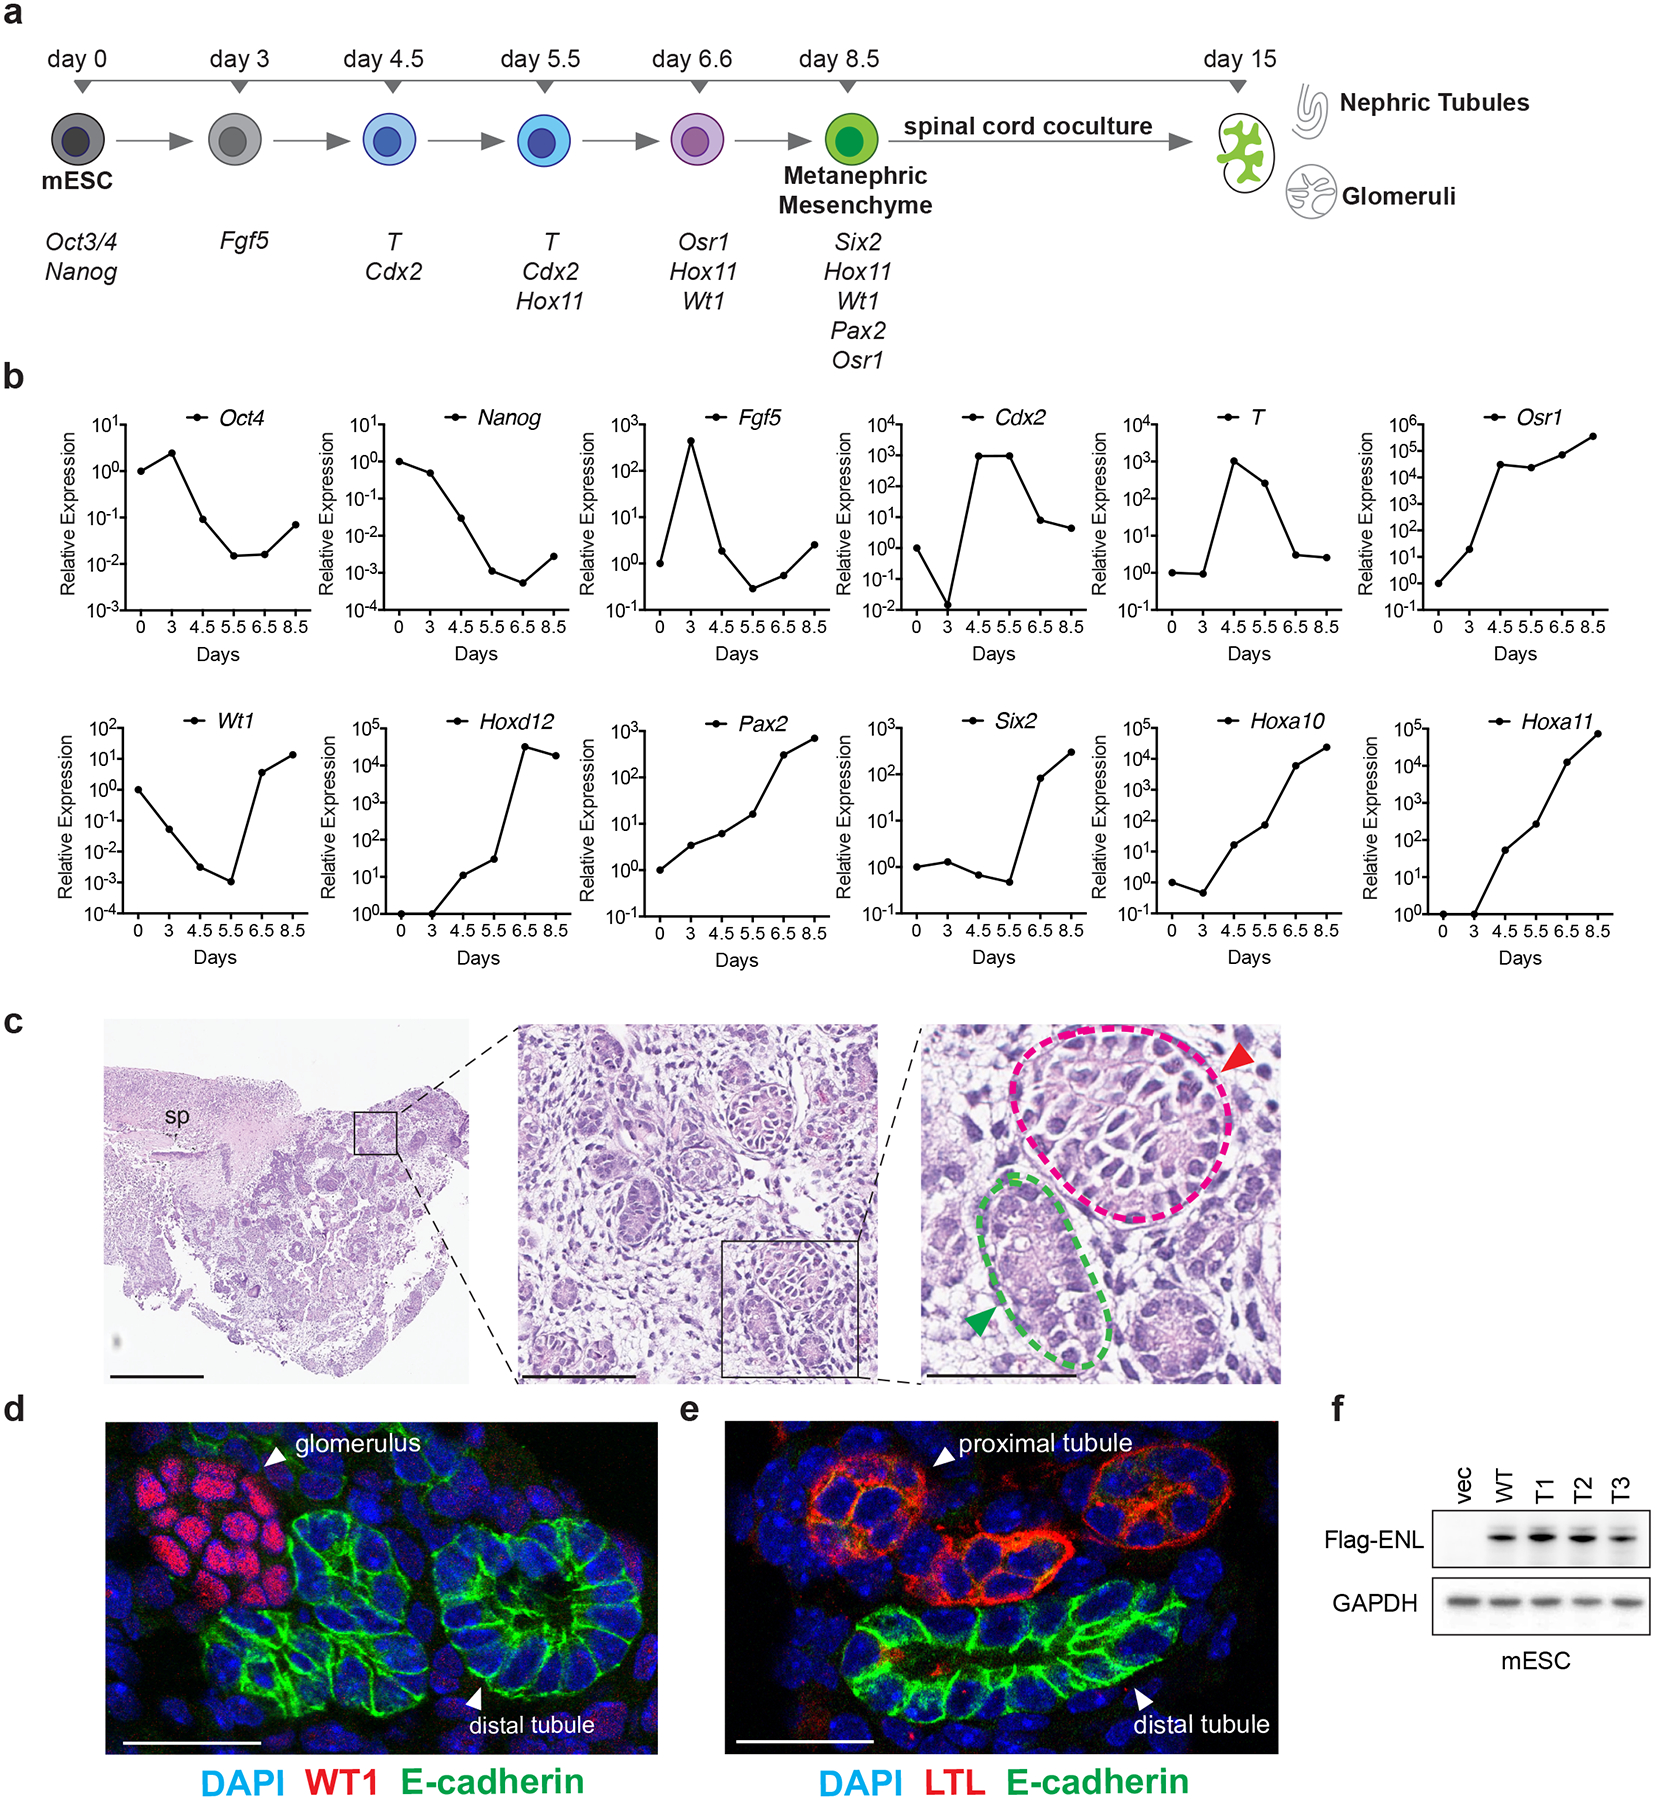
a, Diagram showing the in vitro directed differentiation assay. Signature genes expressed at each step are shown at the bottom. T, the Brachyury gene. b, mRNA expression analysis (normalized to Gapdh) of the indicated genes at different time points during the assay. Data shown are representative of two independent experiments. c, Haematoxylin and eosin staining shows the induced embryoid body co-cultured with the spinal cord (sp). Green and red arrowheads point to nephric tubule and glomerulus, respectively. Scale bars: left, 500 μm; middle, 100 μm; right, 50 μm. d, Representative immunofluorescence staining of induced kidney structures for the nephric distal-tubule marker E-cadherin (green) and the glomerular marker WT1 (red). DNA is stained with DAPI (blue). Scale bar, 25 μm. e, Representative immunofluorescence staining of induced kidney structures for E-cadherin (green) and the proximal-tubule marker lotus tetragonolobus lectin (LTL, red). DNA was stained with DAPI (blue). Scale bar, 25 μm. f, Western blot showing the protein levels of ectopically expressed WT or mutant Flag-tagged ENL in mESCs. For gel source data, see Supplementary Fig. 1. For panels c–f, independent experiments were repeated three times with similar results.