Figure 3.
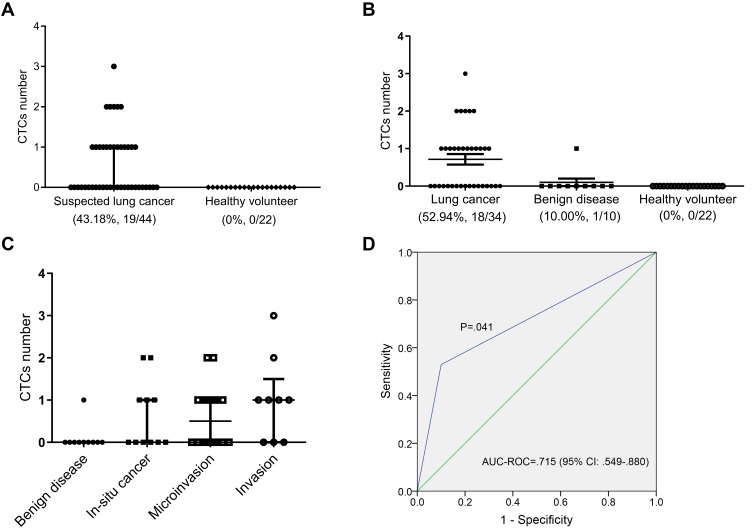
CTCs detection in suspected lung cancer patients and healthy controls. (A) CTCs counts and detection rate in suspected lung cancer patients and healthy controls. (B) CTCs counts and detection rate in patients diagnosed with lung cancer and benign disease by pathology. (C) CTCs counts and detection rate in different groups of patients (benign disease group, in situ cancer group, microinvasive group, and invasive group). Bar values represent the median and interquartile range. (D) ROC curve using CTC counts to distinguish benign and malignant nodules.

