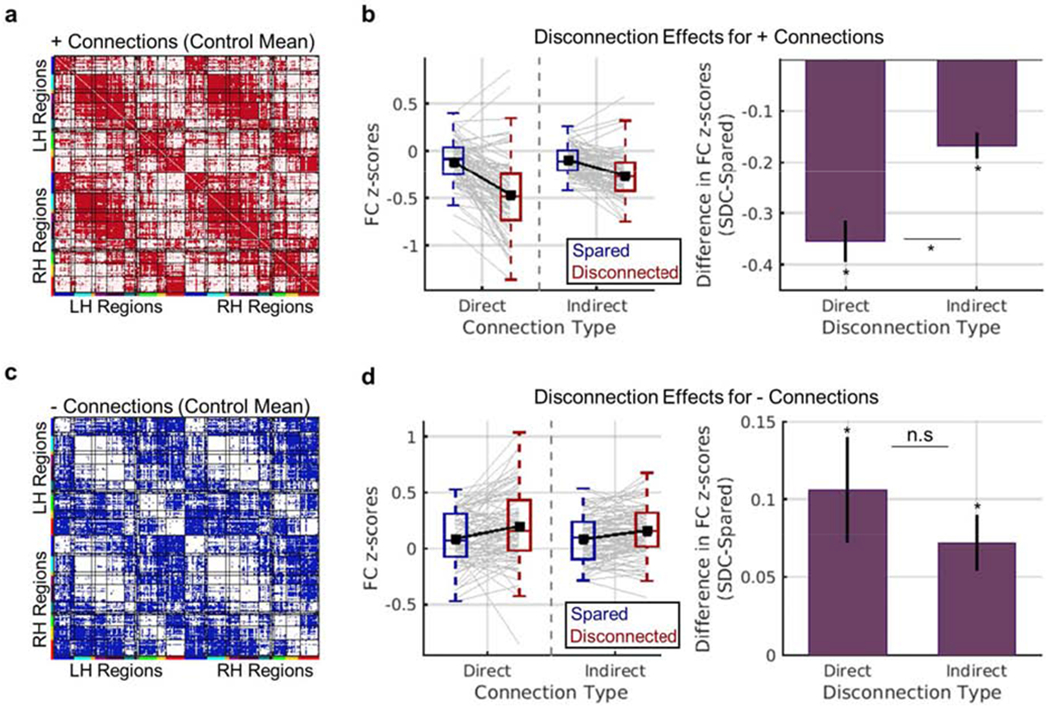
Fig. 6.

Effects of direct and indirect disconnection on functional connectivity. (a-b) Results for positive functional connections. (a) The matrix shows positive functional connections from the mean control functional connectivity matrix in red. The analyses shown in (b) were restricted to these connections. (b) Left – Distributions of mean patient-level functional connectivity z-scores (y-axis) for each connection status (blue vs. red boxplots) and connection type (x-axis). Grey line plots correspond to individual patient observations, and black line plots show group-level means. Right – Data are summarized to show group-level mean (+/− SEM) differences in functional connectivity z-scores (y-axis) between regions with disconnected vs. spared direct and indirect connections (x-axis). (c-d) Results for negative functional connections. (c) The matrix shows negative functional connections from the mean control functional connectivity matrix in blue. The analyses shown in (d) were restricted to these connections. (d) Same as (b), but for negative functional connections. *dependent samples t-test FWEp<0.004. See also Figs. S3–S4.
