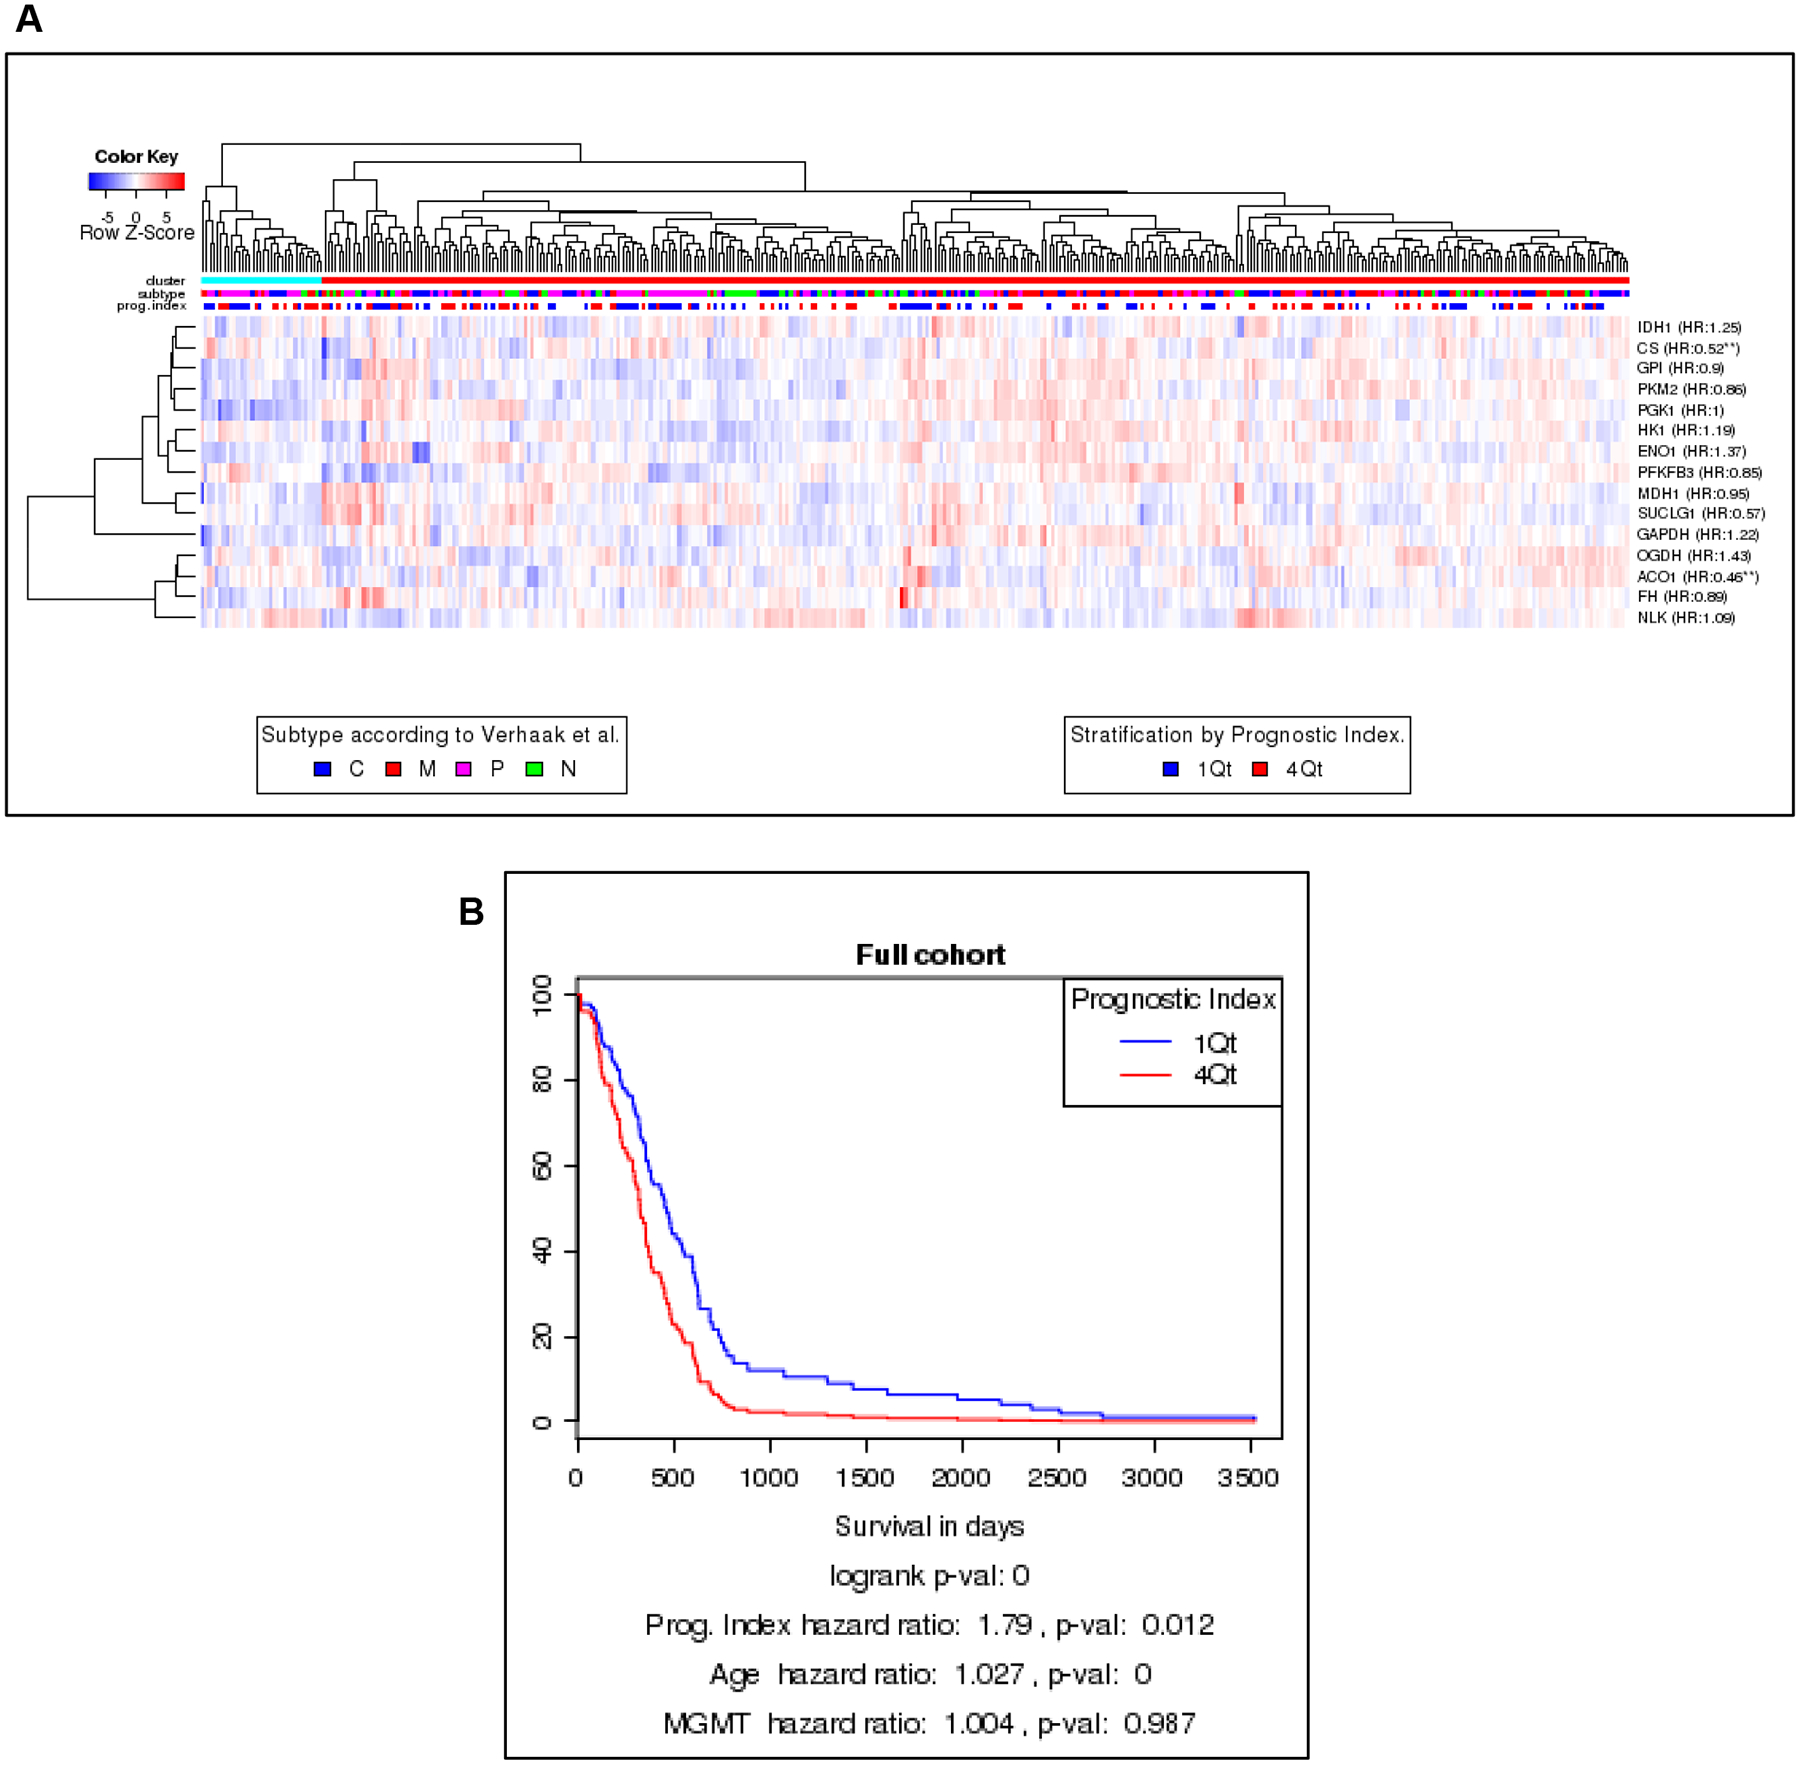
Figure 1.

Metabolic enzyme expression as a prognostic indicator. A) The Glioblastoma Bio Discovery Portal identified 15 metabolic enzymes mapped to mRNA in the Cancer Genome Atlas database in order to separate GBM patients into two main clusters. A higher percentage of samples of proneural and classical GBM samples were in one group (left cluster, blue bar) while the other group (right cluster, red bar) contained higher percentages of mesenchymal samples. Samples in the neural subclass were distributed throughout both groups B) Kaplan-Maier analysis of prognostic index (PI) compared to overall survival showing patients with a PI in the first quartile survived longer than those in the fourth (HR 1.8, p=0.012).
