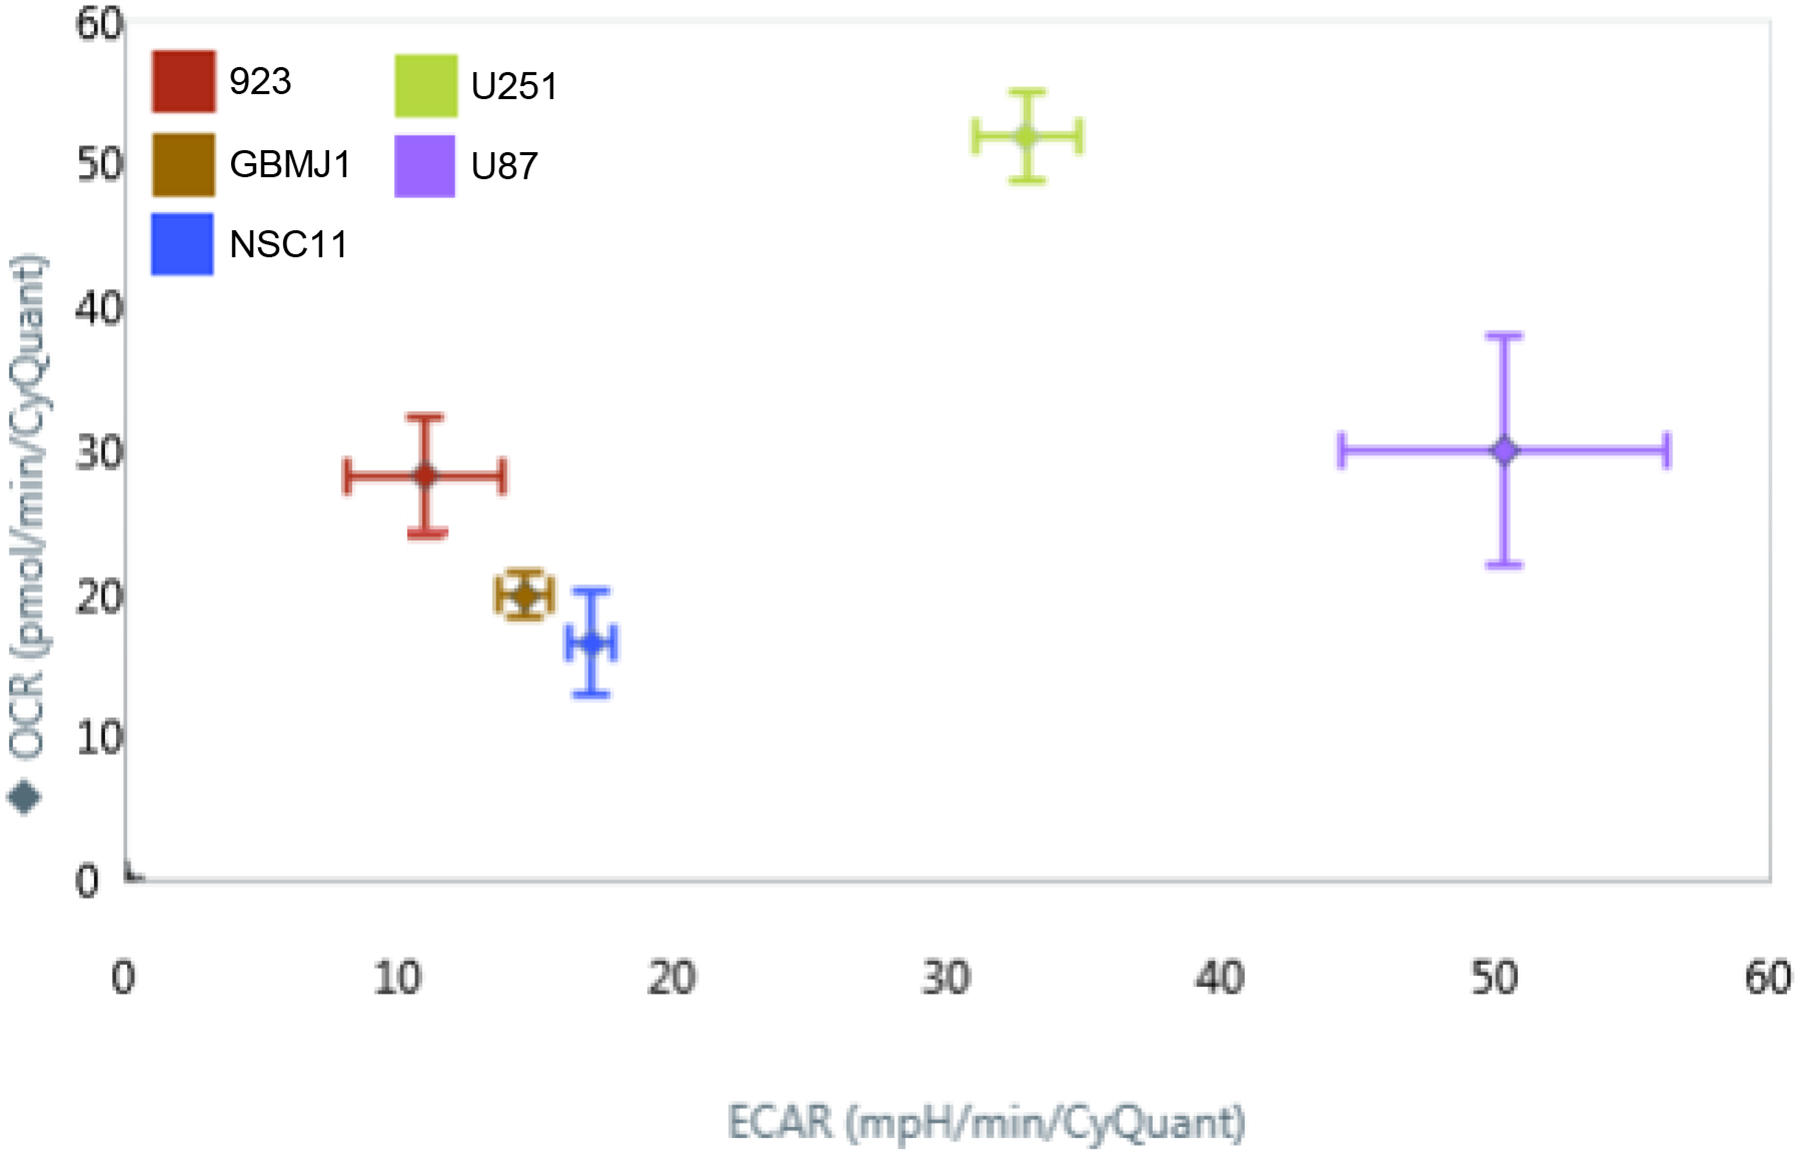
Figure 2.

A glycolysis stress test run on a Seahorse XFe96 Analyzer platform revealed the oxygen consumption and extracellular acidic rate of normal adherent glioma cell lines (U251, U87) and glioma stem-like cell lines (923, GBMJ1, NSC11). GSLCs were clustered with a lower OCR and ECAR compared to adherent cell lines.
