Figure 4.

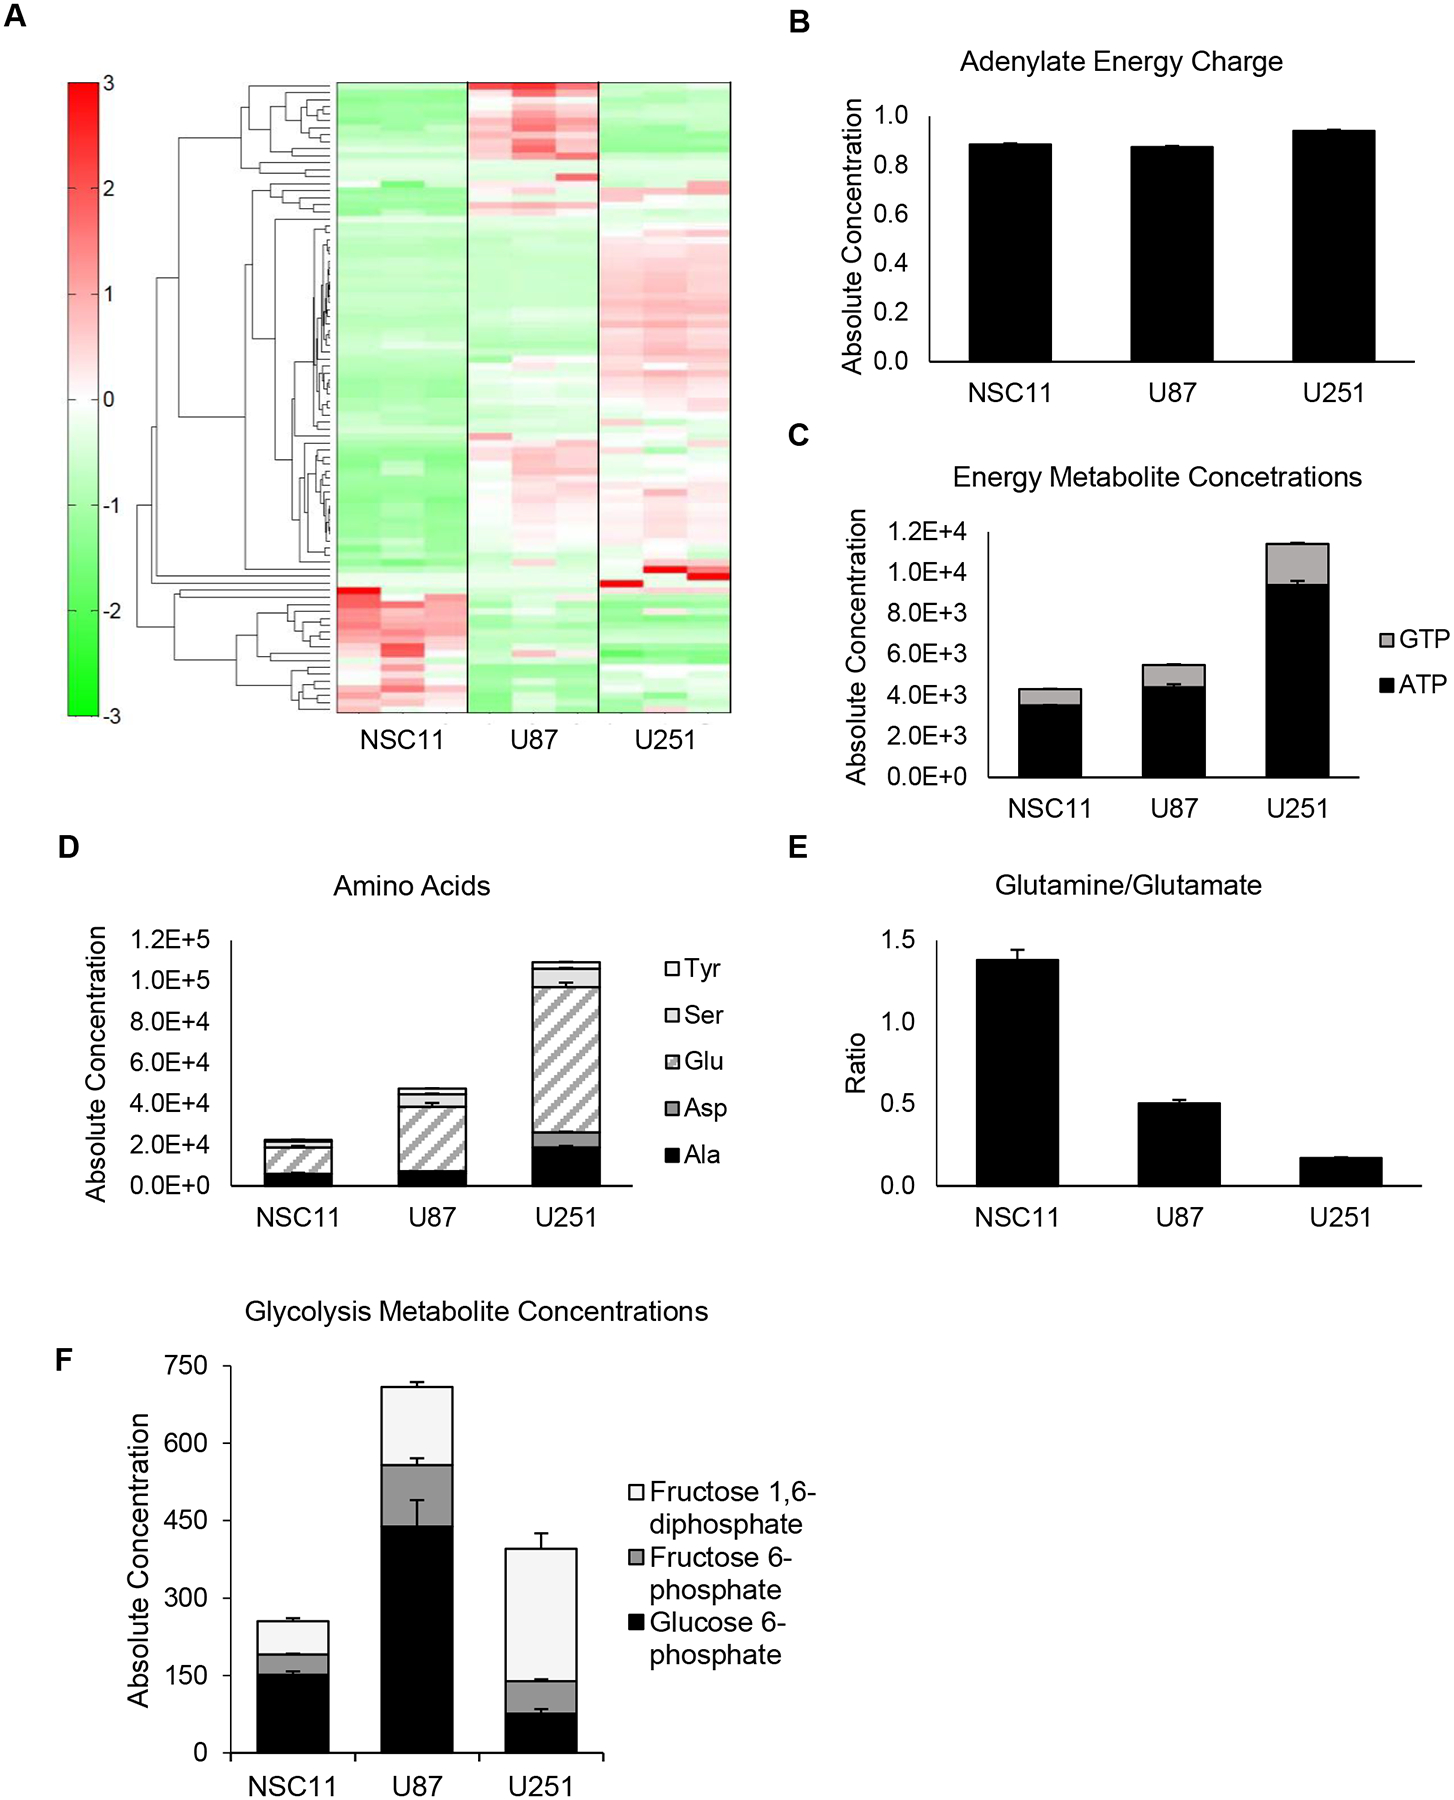
GBM cell lines express high levels of energy and amino acid metabolites as compared to GSLCs. A) Metabolomic analysis displaying distinct metabolite profiles between GSLCs and individual GBM cell lines. B) Adenylate energy charges were equivalent for all cell types (~ 0.9), indicating a steady state in metabolism. U251 cells had the highest C) energy metabolite concentration (p<0.0001 [+ GTP, * ATP]) and D) amino acid concentrations (p<0.0001) consistent with its energetic phenotype. E) The high glutamine/glutamate ratio exhibited by NSC11 (p<0.01) are characteristic of quiescent phenotypes. F) NSC11 also demonstrated lower levels of total glycolytic metabolite concentrations (p<0.01 compared to U87). Values represent the mean ± standard deviation for 3 independent trials (** p<0.01, *** p<0.001, **** p<0.0001).
