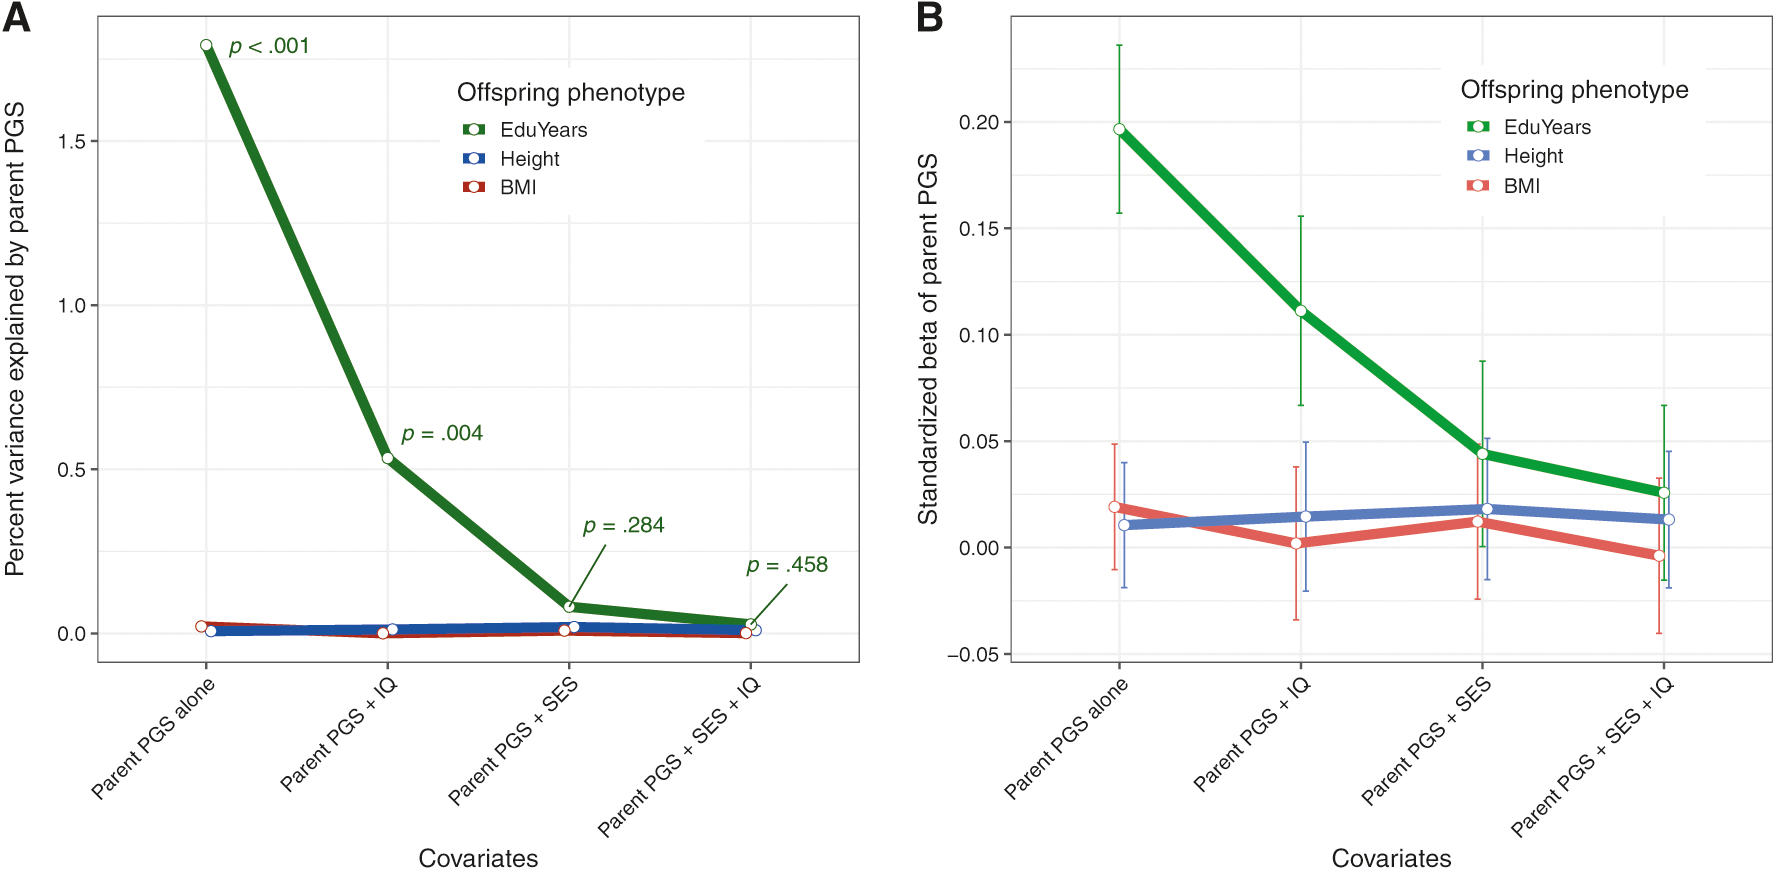
Fig. 4.

Line graphs comparing the effects of parent characteristics as covariates on a the incremental variance explained and b size of the standardized β-coefficient of parental polygenic score (PGS). Each regression model used the parent and offspring PGS specific to its dependent variable (EduYears, height, or body-mass index (BMI)). The error bars in panel b represent ± 1 standard error
