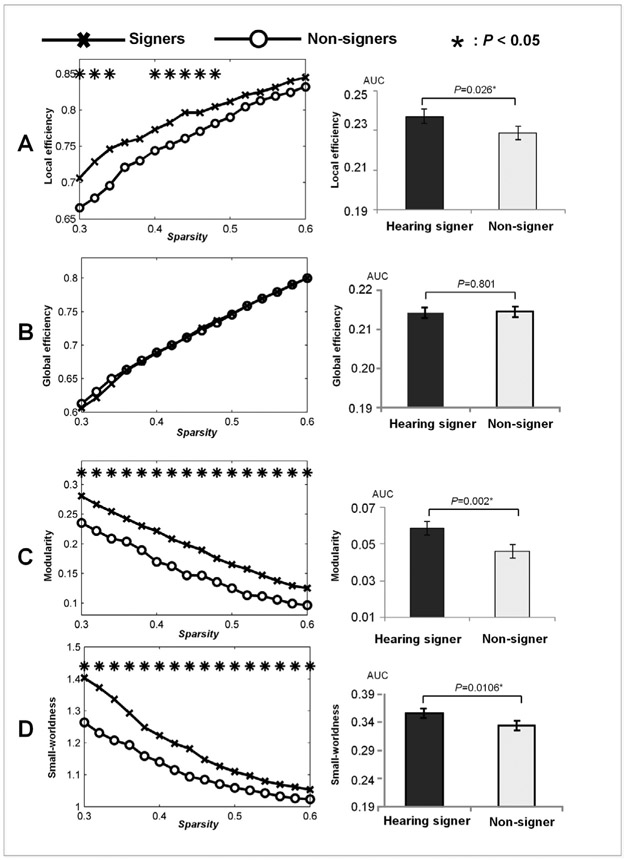
Fig. 3.
Between-group comparisons in graph properties including local efficiency (A), global efficiency (B), modularity (C) and small-worldness (D). The left column: results for the graph properties that were obtained over a range of thresholds (0.3–0.6). Right column: results for the sparsity-integrated graph properties.

