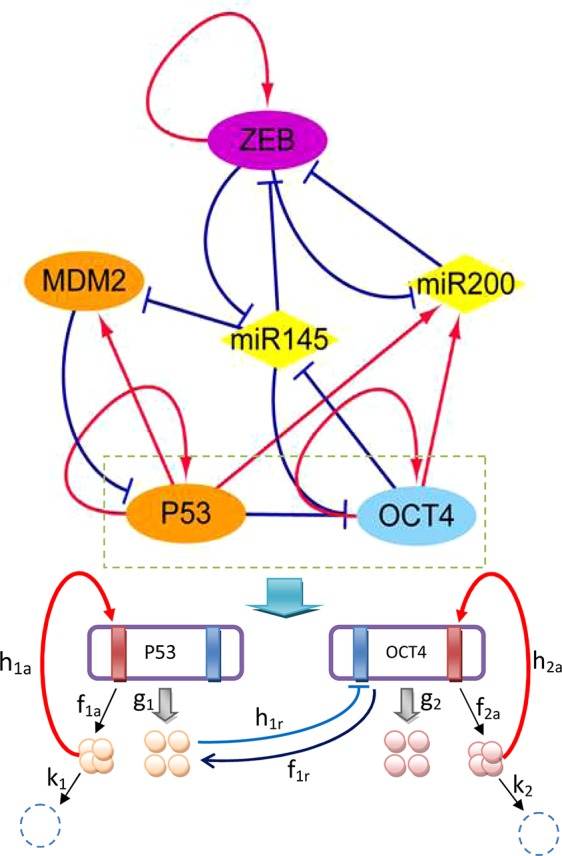
Figure 1.

Diagram of the core gene regulatory network containing six nodes and 16 regulations (seven activations and nine repressions; arrows represent activating regulations, short bars represent repressing regulations). Diamond-shaped nodes represent microRNAs. Round orange nodes represent specific cancer genes, violet node represents the specific EMT gene, blue represents the specific CSC gene. Parameters: k 1 = k 2 = 1, λa = 8, λr = 0.5, ha = 2, hr = 1.875, g 0 = 50, f = k ∗ ω.
