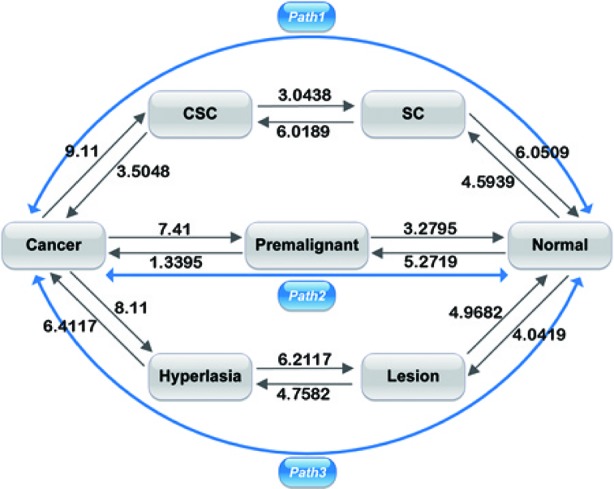
Figure 4.

Barrier heights between normal, premalignant, cancer, SC, Cancer stem cell (CSC), lesion, and hyperplasia states, and optimal paths among these states. Black arrows represent the barrier from one state to another. The data marked represent the barrier height to overcome. Blue arrows represent the kinetic paths from normal to cancer state and the reverse.
