Figure 5.

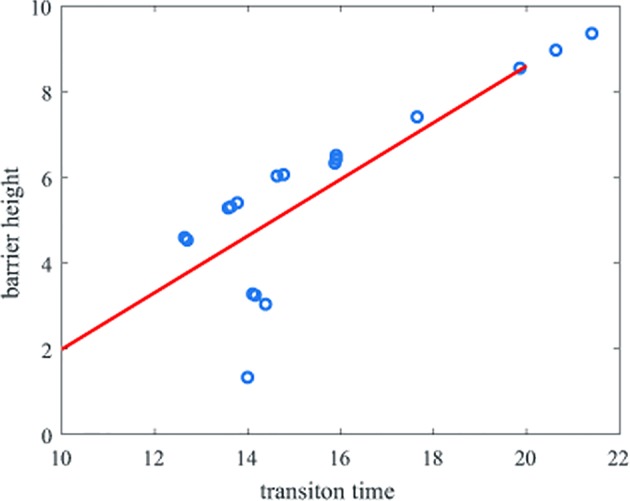
Correlation of the transition time and barrier heights. The y-axis represents the barrier height and the x-axis represents the natural logarithm of the transition time.

Correlation of the transition time and barrier heights. The y-axis represents the barrier height and the x-axis represents the natural logarithm of the transition time.