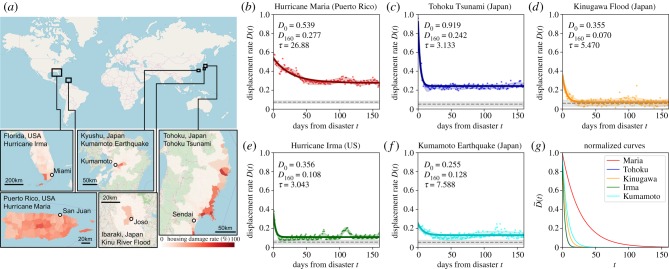
Figure 1.
Similarity of macroscopic population recovery patterns across the five disasters. (a) Location, spatial scale and severity of disasters that were studied. Red colours indicate the percentages of houses that were severely damaged in each community. (b–f) Macroscopic population recovery patterns after each disaster. Raw observations of displacement rates were denoised using Gaussian process regression and were then fitted with a negative exponential function. D0, D160 and τ denote the displacement rates on day 0, day 160 and recovery time parameter of each fitted negative exponential function. Black horizontal dashed line shows average displacement rates observed before the disaster. (g) Normalized population recovery patterns after Hurricane Maria (red), Tohoku Tsunami Tsunami (blue), Hurricane Irma (green), Kumamoto Earthquake (cyan), Kinugawa Flood (orange).

