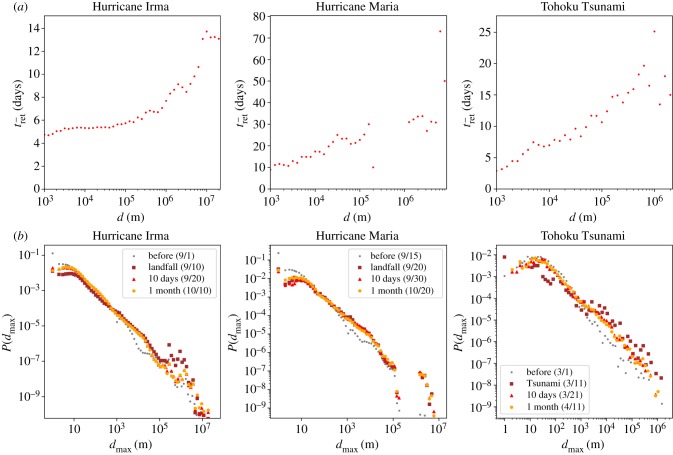
Figure 2.
Relationship between displacement distance and duration after disasters. (a) The longer the evacuation distance, the longer the average evacuation duration. (b) Probability densities of maximum distance from home on a usual day (grey) and at various timings after the disaster day (brown: day of occurrence, red: 10 days after, orange: one month after) are all long-tailed. The long-tailed distribution of evacuation distances and the relationship between displacement distance and duration were common across disasters. The majority of people evacuating short distances (thus short duration) and a small fraction of the people evacuating extremely long distances (thus long duration) explains why similar negative exponential functions were observed after the disasters.

