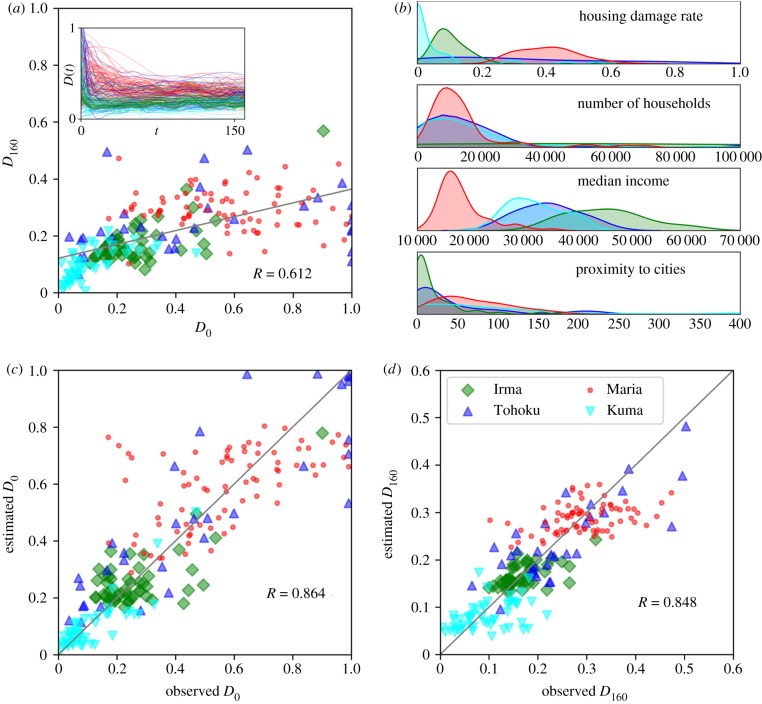
Figure 3.
Explaining the spatial heterogeneity in population recovery using key common factors. (a) D0 and D160 of all LGUs. Each trajectory corresponds to an LGU, and colours represent the disaster. D0 and D160 have a moderate correlation of R = 0.612. The inset shows the high spatial heterogeneity of recovery trajectories. (b) Density plots of the four features of the affected LGUs, showing the heterogeneity in socio-economic characteristics. (c) Observed and estimated D0 for all LGUs in all disasters had high correlation R = 0.864. (d) Observed and estimated D160 values had high correlation R = 0.848.

