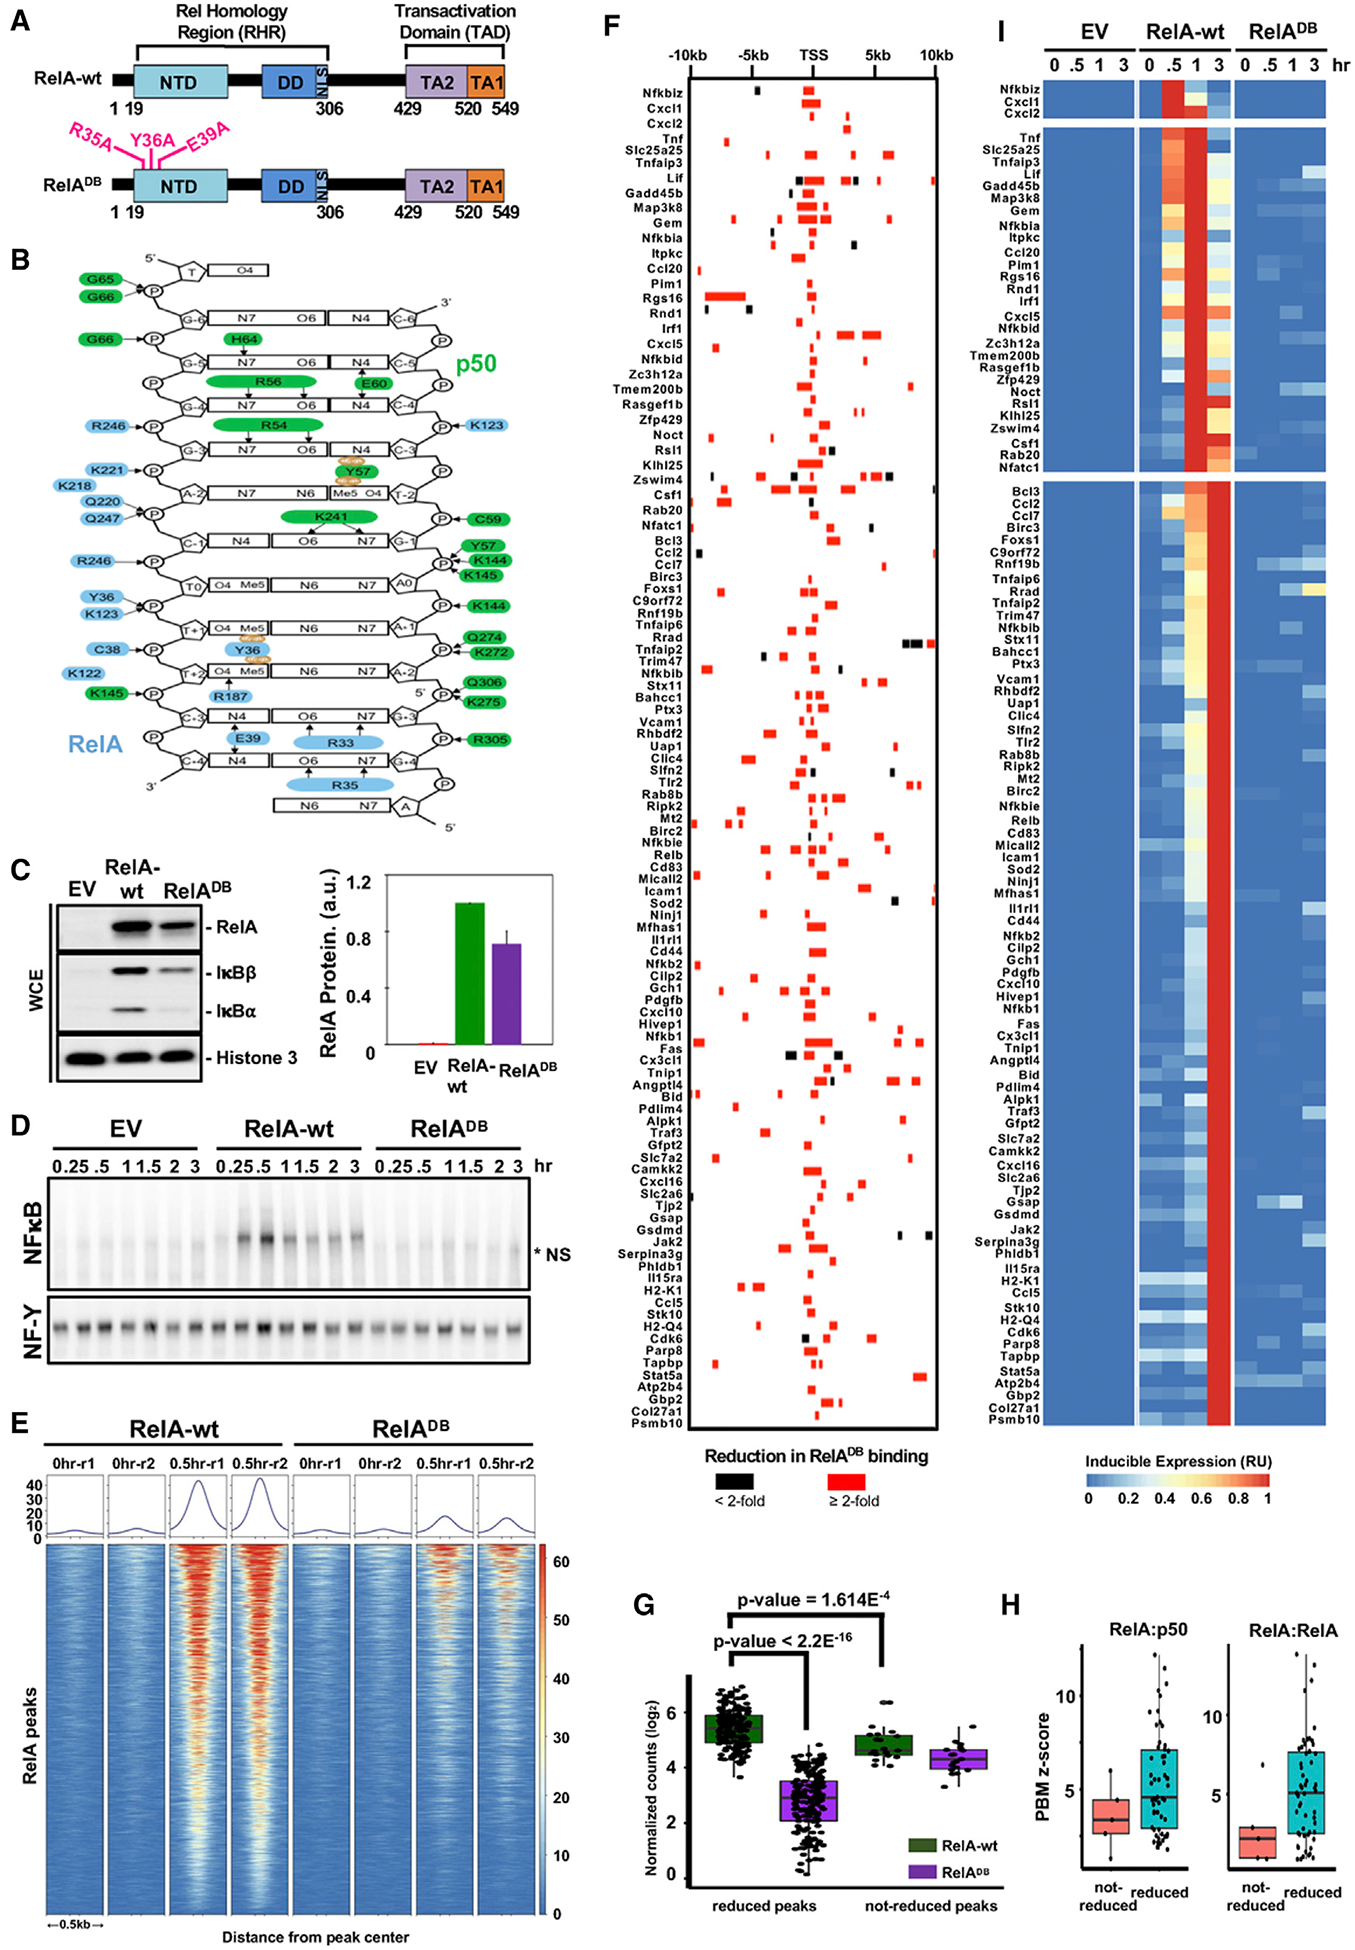
Figure 3. High-Affinity Binding by RelA Is Required for the TNF-Induced Expression of All NF-κB Target Genes.

(A) Schematic representation of the targeted mutations in the DNA binding mutant of murine RelA (R35A, Y36A, and E39A).
(B) Schematic of the κB DNA contacts made by RelA:p50 NF-κB heterodimer, adapted from Chen et al. (1998a). The heterodimer structure reveals base-specific contacts made by specific amino acids in the RelA protein, indicating the critical roles of R35, Y36, and E39. Arrows denote hydrogen bonds; brown ovals indicate Van der Waals contacts.
(C) Protein expression of RelA, IκBβ, IκBα, and histone 3 as loading control, by immunoblot in unstimulated cells genetically complemented with indicated EV, RelA-wt, and RelADB. Quantified protein expression is shown on the right. Error bars represent the standard deviation from two independent experiments.
(D) Analysis of nuclear NF-κB activity by EMSA with κB and NF-Y (loading control) probes of nuclear extracts prepared at indicated times after TNF stimulation of genetically complemented cells shown in (C). The data are representative of two independent experiments. *NS, non-specific band.
(E) Heatmap density shows RelA ChIP-seq peaks at 9,829 locations defined in Figure 1A, in genetically complemented (RelA-wt and RelADB) p53−/− crel−/− rela−/− MEFs in response to 0.5 h of TNF stimulation.
(F) A map of RelA binding events associated with 104 NF-κB target genes indicating whether RelA binding is reduced ≥2-fold in the RelADB mutant (red bar).
(G) Quantification and comparison of RelA peaks shown in (F). Averaged normalized counts from two replicates of RelA ChIP-seq experiments in RelA-wt or RelADB expressing MEFs are plotted to compare RelA peaks that are highly dependent on high-affinity binding by RelA versus those that are less dependent. For each category, Mann-Whitney U-test results indicate that peaks less dependent on high-affinity binding by RelA show a lower read count in RelA-wt control cells.
(H) Correlation between RelA ChIP-seq peaks and protein-binding microarray (PBM)-determined z-scores of the strongest-κB binding-site sequences for RelA:p50 and RelA:RelA dimers retrieved from Siggers et al (2011). Of the seven 10-bp κB site sequences within not-reduced RelA peaks; the five with the strongest z-scores were plotted.
(I) Heatmap for the transcriptional TNF response of the 104 target genes in genetically complemented RelA-wt and RelADB cells, analyzed by polyA+ RNA-seq.
