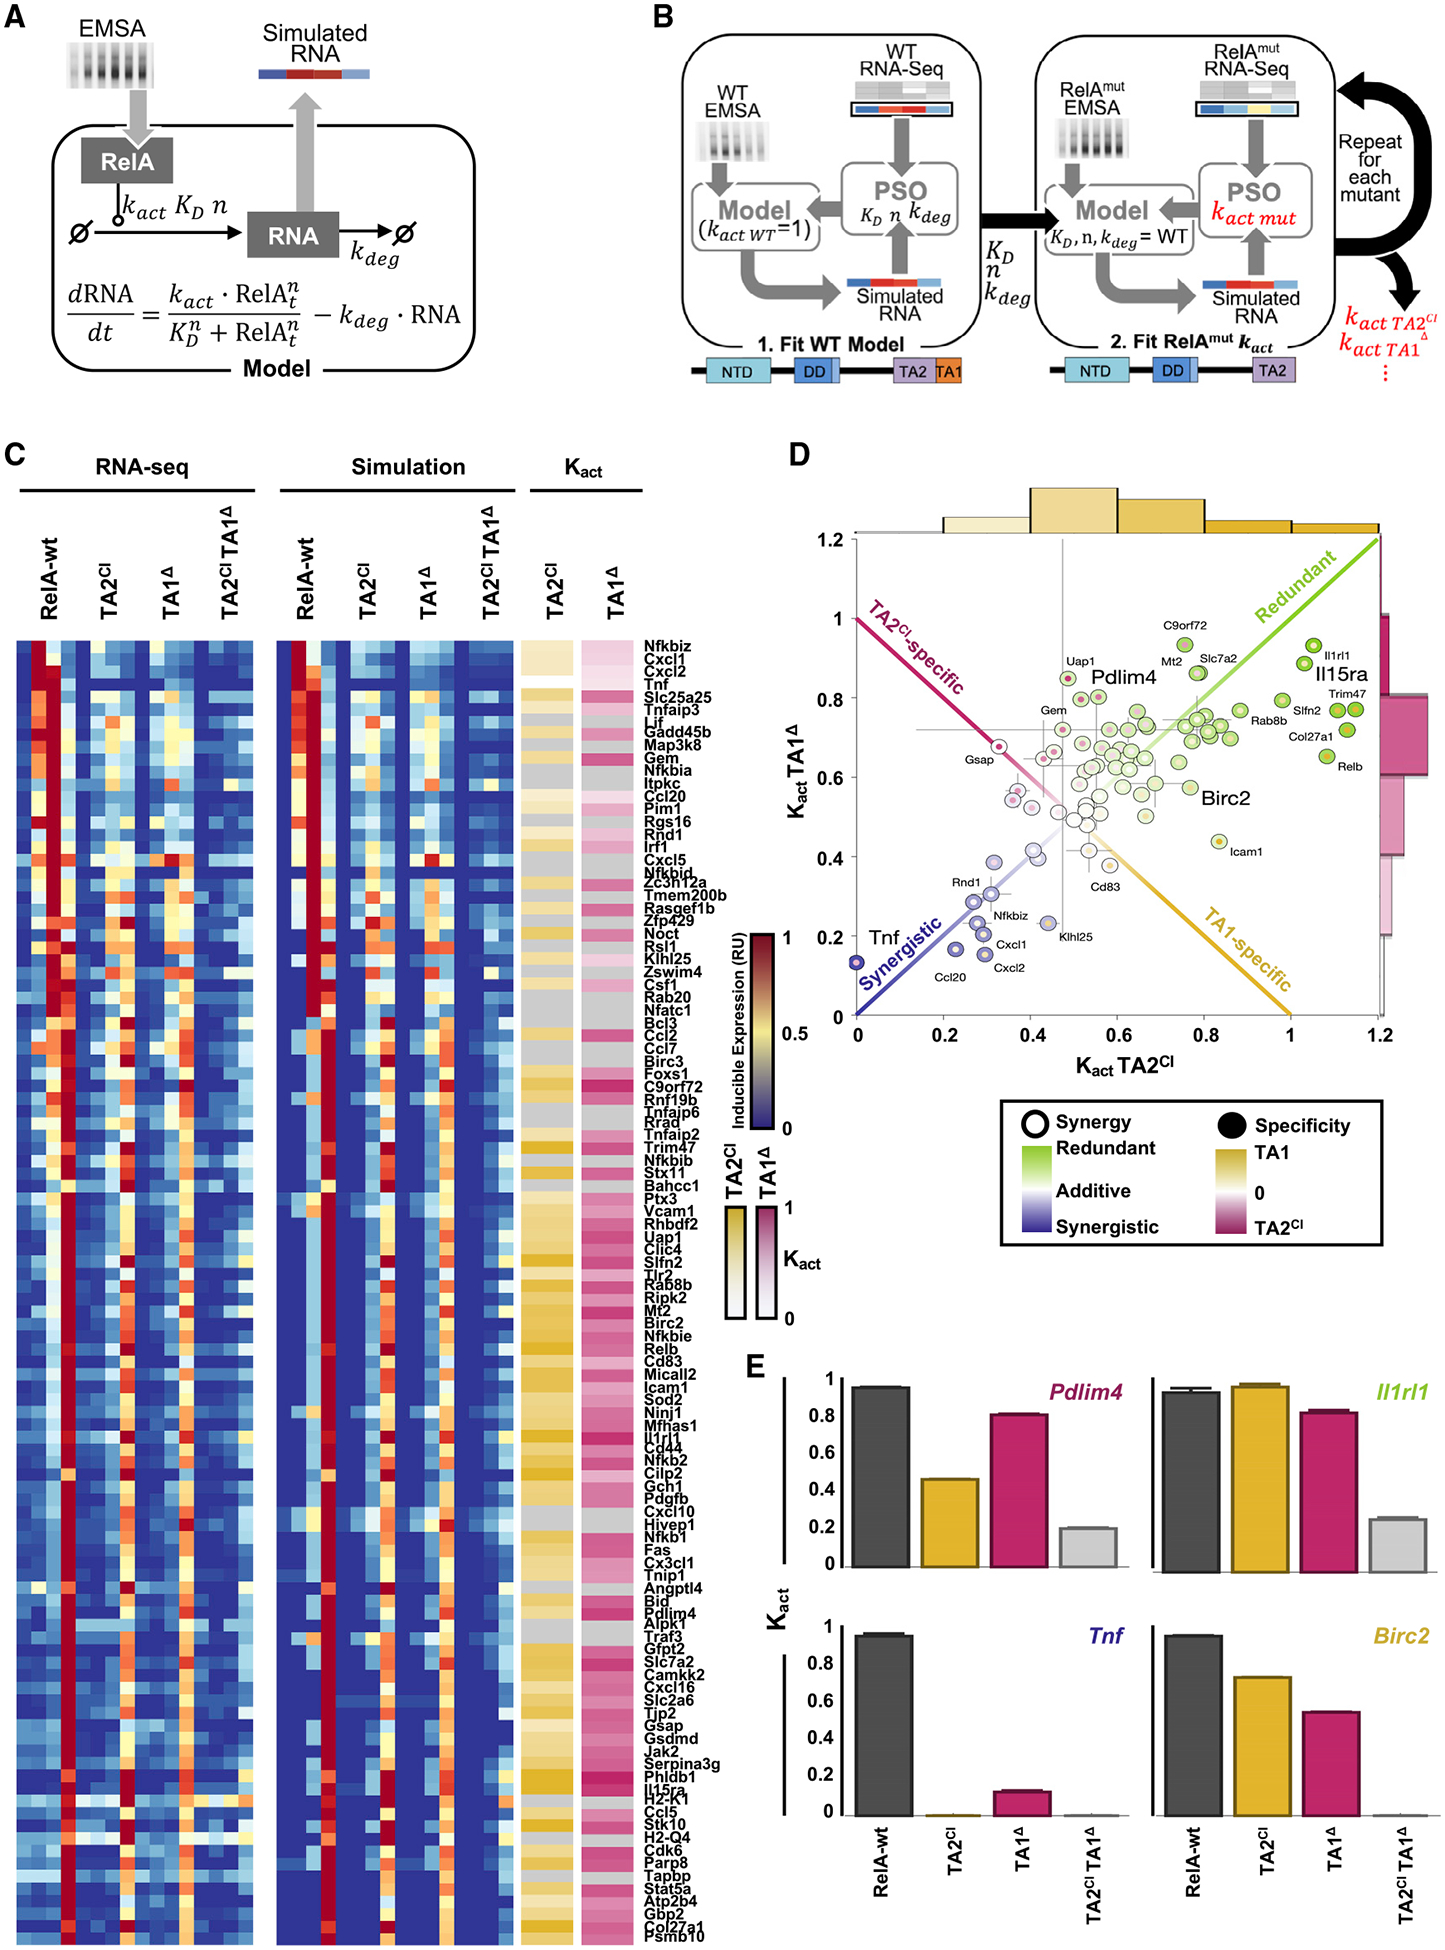
Figure 6. A Math Model-Aided Analysis Reveals Gene-Specific Requirements for TA1 and TA2.

(A) Schematic of the ordinary differential equation (ODE) used to obtain simulated mRNA dynamics from quantified NF-κB activity time courses.
(B) Schematic of the particle swarm optimization (PSO) pipeline used to quantify the activation strengths (kact) for TAD mutants. First KD, nhill, kdeg are fit to RelA-wt data with kact = 1. The identified parameters are then maintained with the new kact fit for each TAD mutant to obtain the remaining activation strength (see Method Details).
(C) Experimental (left, RNA-seq) and simulated best-fit mRNA time-course (middle) heatmaps, along with identified kact for TA2CI (yellow) and TA1Δ (pink). kact is shown relative to RelA-wt with brighter colors indicating closer activity to RelA-wt (no effect of mutation) and white indicating complete loss of activity in the mutant (kact = 0). Gray indicating a fit with ln (dist) < − 2:5 (see Method Details) was not found.
(D) Scatterplot of kact for TA2CI and TA1Δ for 76 genes with a good fit in (C). Center color represents the effect of either a single mutation (from green kact = 1 with no change from RelA-wt and redundancy with respect to a single mutation, to blue kact = 0 where either mutation abrogates gene induction and both domains work synergistically to achieve full gene activation). Border colors represent an off-diagonal effect in which a gene shows a specific loss of induction in TA2CI (pink) or TA1Δ (yellow). Gray lines indicate the standard deviation of kact from three repeated runs of optimization pipeline.
(E) Bar graphs of kact (relative to the mean RelA-wt kact) for RelA-wt, TA2CI, TA1Δ, and TA2CITA1Δ mutants, shown for four example genes arranged to indicate their relative positions in (D). Error bars indicate standard deviations of kact from three repeated runs of optimization pipeline.
