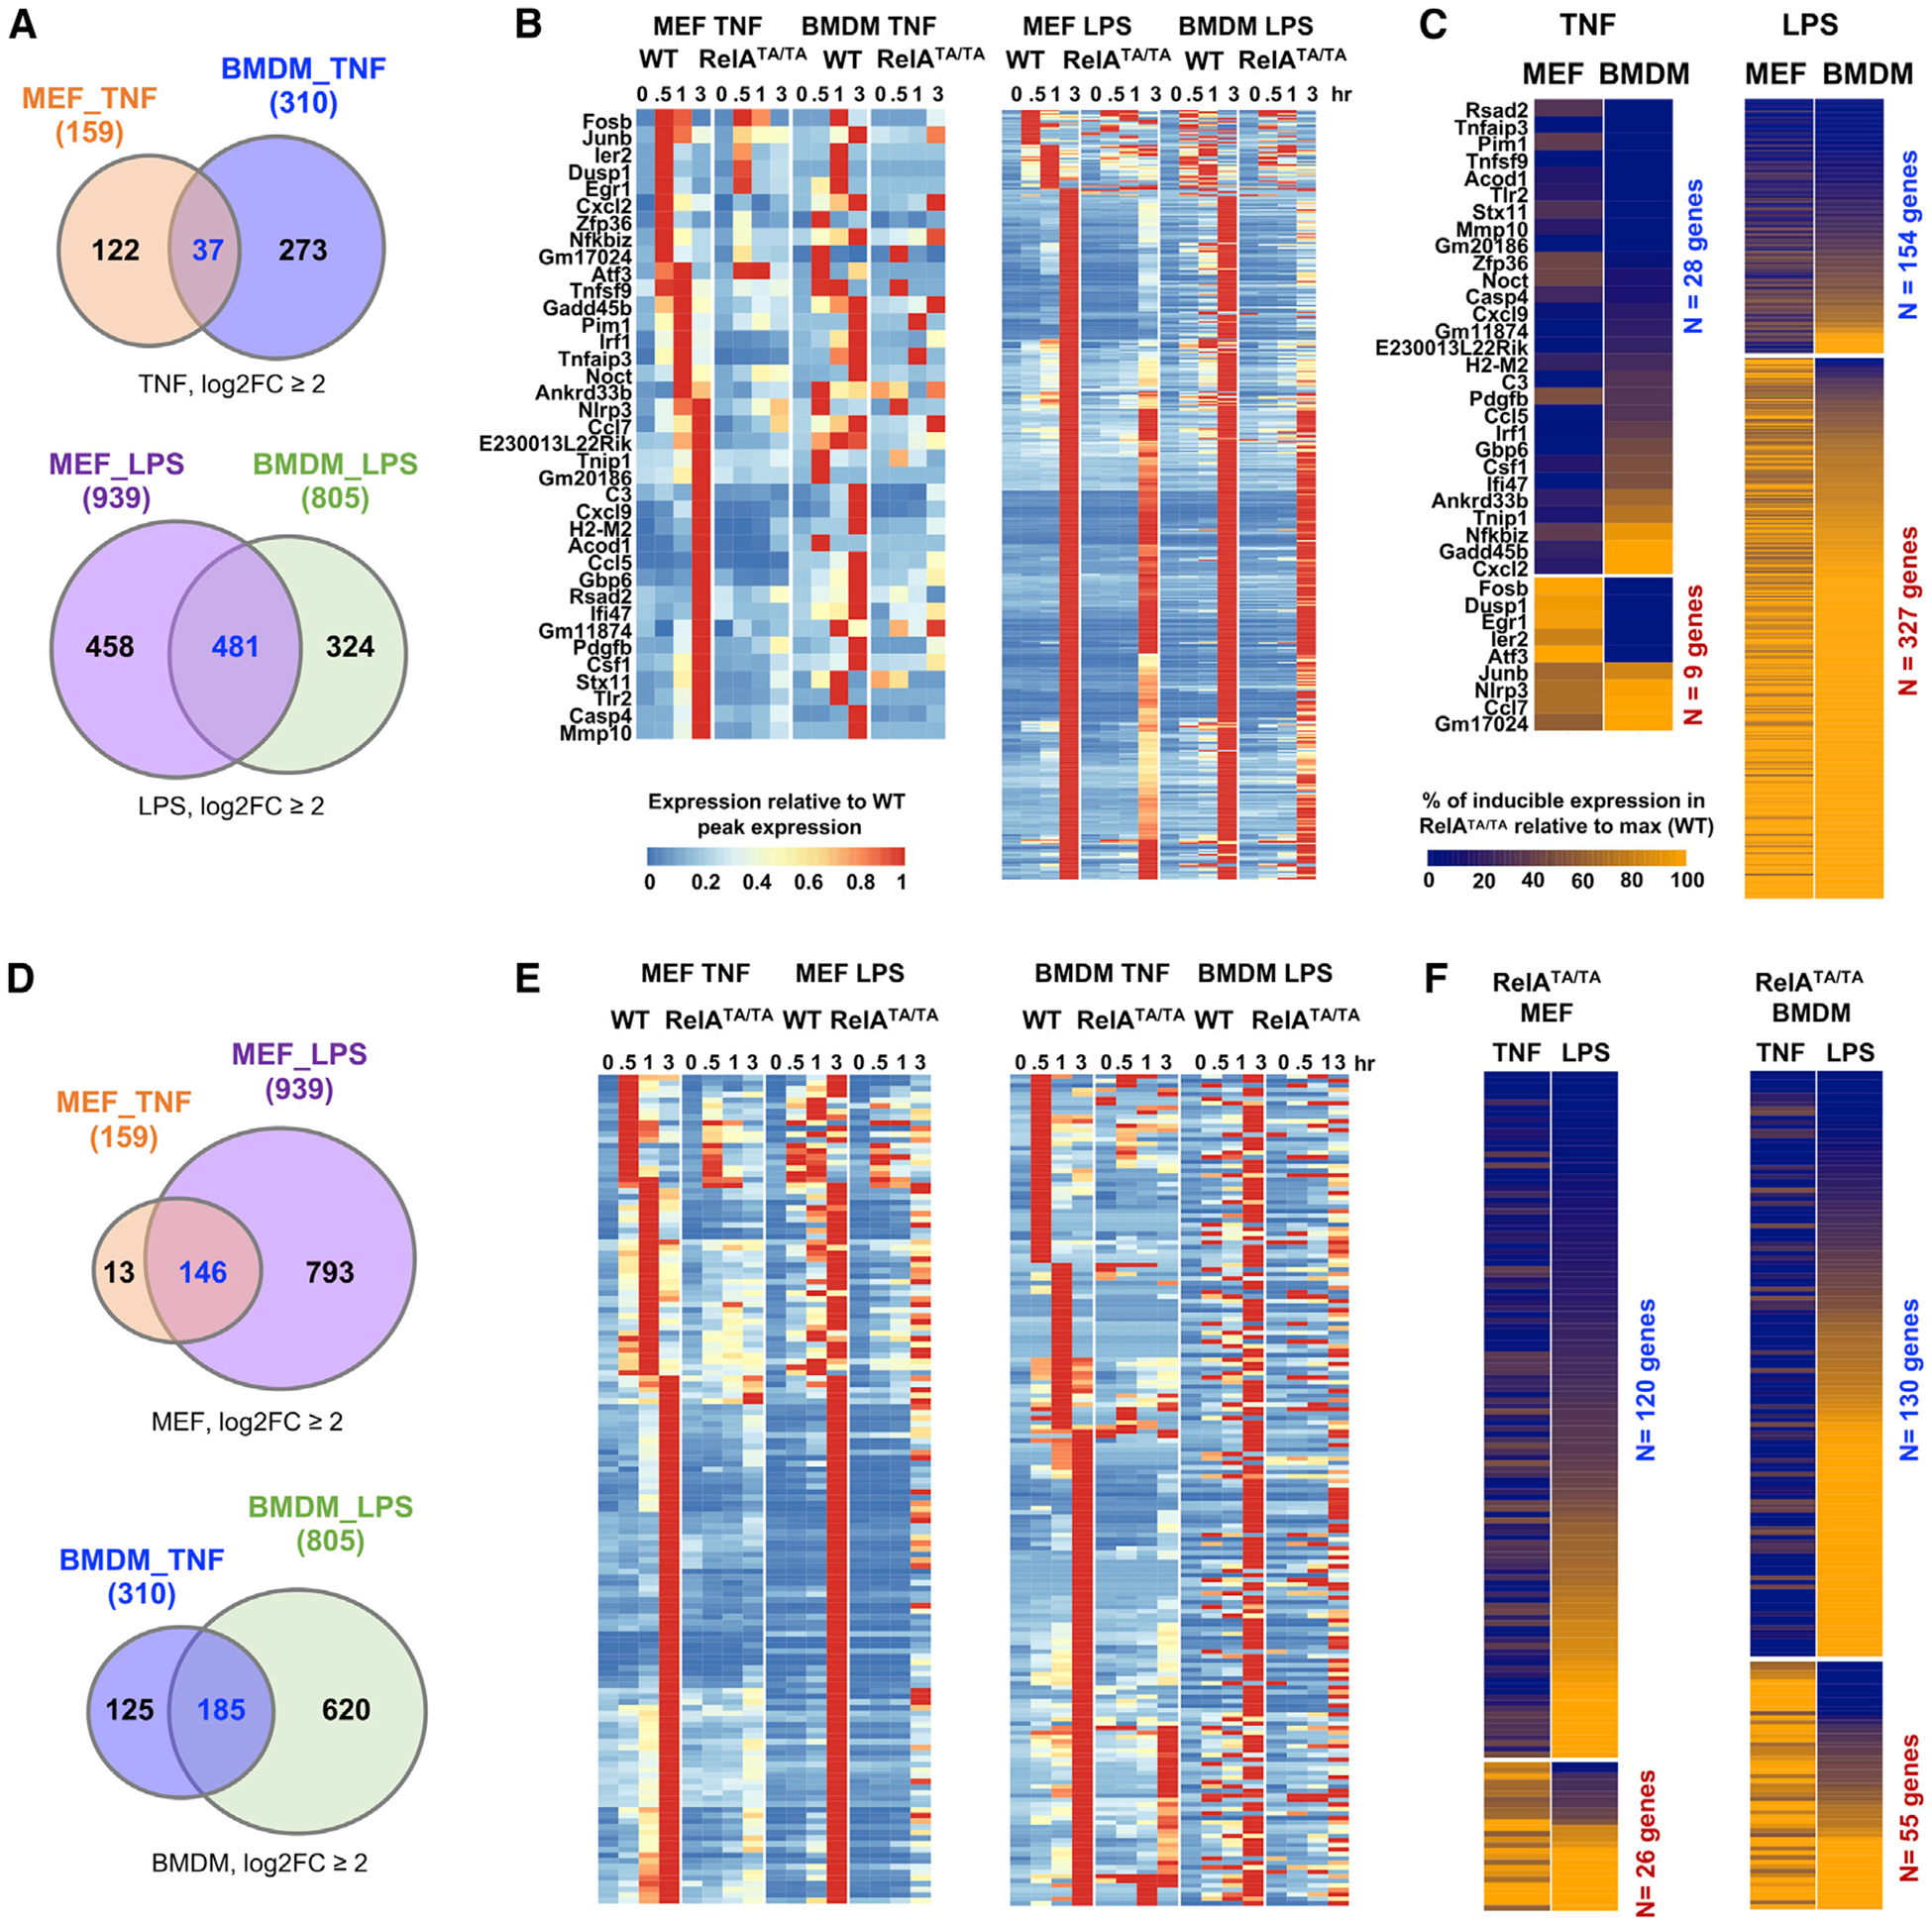
Figure 7. A Knockin Mouse Reveals that the Dual TAD Requirement Pertains to Other Cell Types and Stimuli.

(A) Venn diagrams display overlap in induced transcriptional response in MEFs and BMDMs. Induced genes satisfy two criteria: log2 fold-change ≥2 and maximum RPKM >1, by polyA+ RNA-seq during a 3-h time-course analysis. In response to TNF, 159 genes are induced in WT MEFs and 310 are induced in WT BMDMs (left panel). In response to LPS, 939 genes are induced in WT MEFs and 805 induced genes in WT BMDMs (right panel).
(B) Heatmaps of relative expression of the induced genes in WT and RelATA/TA mutant MEFs or BMDMs in response to TNF (left panel) or LPS (right panel). Gene names and data plotted in heatmaps are listed in Tables S2A and S2B for TNF and LPS, respectively.
(C) RelA-TAD dependence of induced genes: percentage of peak expression in RelATA/TA mutant versus WT. Genes are rearranged by their TAD dependence in TNF stimulation and further re-arranged in each category by LPS response. Genes induced by TNF in MEFs and BMDMs (left panel). Gene names and data plotted in heatmap are listed in Table S2C. Genes induced by LPS in MEFs and BMDMs. Gene names and data plotted in heatmap are listed in Table S2D (right panel).
(D) Venn diagrams displays overlap in induced transcriptional response to TNF and LPS. In WT MEFs, 159 genes were induced by TNF and 939 by LPS (left panel). In WT BMDMs, 310 genes were induced by TNF and 805 were induced by LPS (right panel).
(E) Heatmaps of relative expression of TNF- versus LPS-induced genes in WT and RelATA/TA mutant MEFs (left panel) or BMDMs (right panel). Gene names and data plotted in the heatmap are listed in Tables S3A and S3B for MEFs and BMDMs, respectively.
(F) NF-κB dependence of induced genes: percentage of peak expression in RelATA/TA mutant versus WT. Genes induced by MEFs by TNF and LPS (left panel). Gene names and data plotted in heatmap are listed in Table S3C. Genes induced by BMDMs by TNF and LPS (right panel). Gene names and data plotted in heatmap are listed in Table S3D.
