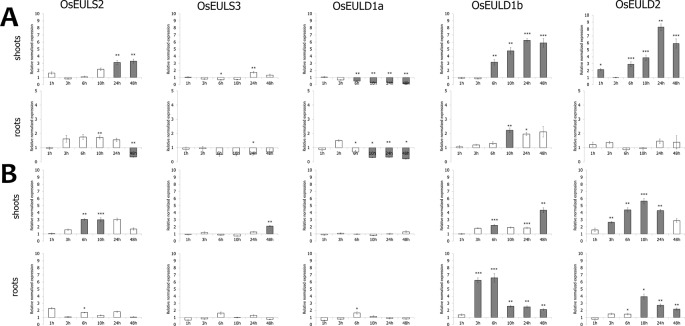
Figure 5.
Transcript levels for OsEUL genes after drought (A) and salt stress (B). Normalized expression levels, relative to the non-treated plants (set to 1), are shown for different time points. The mean values of RT-qPCR for three independent biological replicates were normalized to three reference genes and error bars indicate standard errors. Dark-gray bars represent statistically significant up-regulation of at least two-fold compared to non-treated plants and light-gray bars represent statistically significant down-regulation (*p < 0.05, **p < 0.01, ***p < 0.001).

