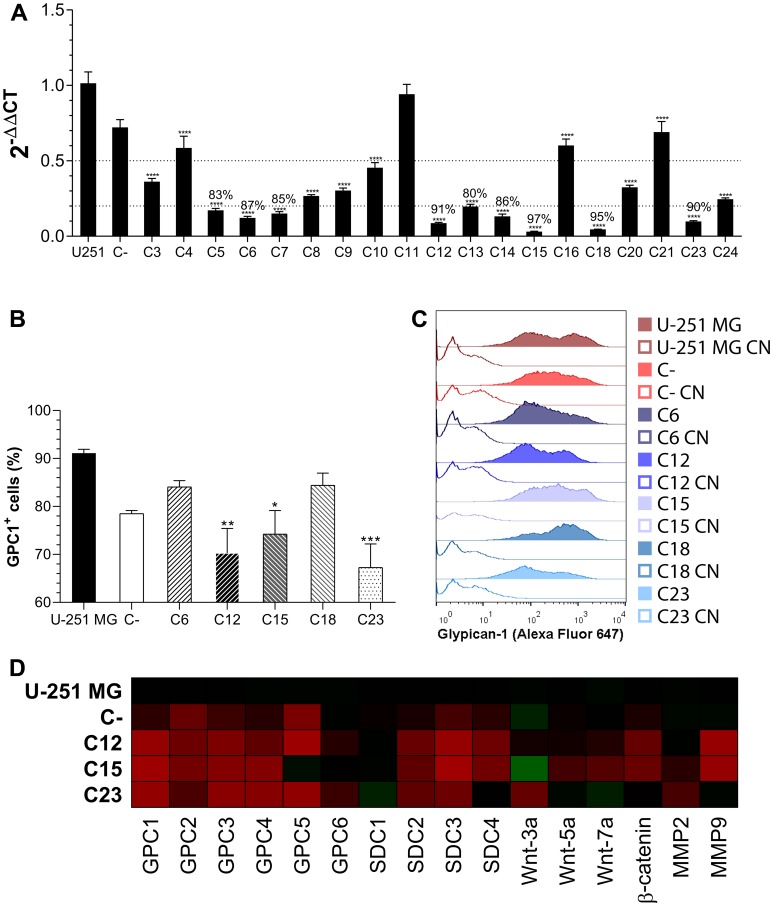
Figure 1. GPC1 knock-down clone selection.
(A) All generated monoclonal cell lines had the GPC1 expression quantified by RT-qPCR. Dotted lines represent 50% and 80% of GPC1 silencing, respectively and, when more than 80% of gene silencing was achieved, the percentage reduction is indicated. (B) Flow cytometry assessment of GPC1 in control GBM cells and the five most GPC1-silenced clones. This representation shows the fraction of GPC1+ cells for each group. (C) Representative histograms of GPC1 fluorescence intensity distribution. Unstained samples are represented by unfilled curves (controls, CN). (D) Transcriptional profile of membrane-bound HSPG, selected Wnt ligands, and MMPs that were assessed by RT-qPCR. The heatmap of 2-ΔΔCt was generated, in which significant comparisons are not indicated but are commented on in the text. Gradients of red indicate diminished expression, and of green heightened expression in relation to U-251 MG. All data are plotted as mean ± SEM. The one-way ANOVA with the Dunnett’s post-hoc test was performed, and statistically significant comparisons are marked as follows: * p < 0.05, ** p < 0.01, *** p 0.001 and **** p < 0.0001 vs. U-251 MG. The sample size was n = 6 for RT-qPCR and n = 5 for flow cytometry.

