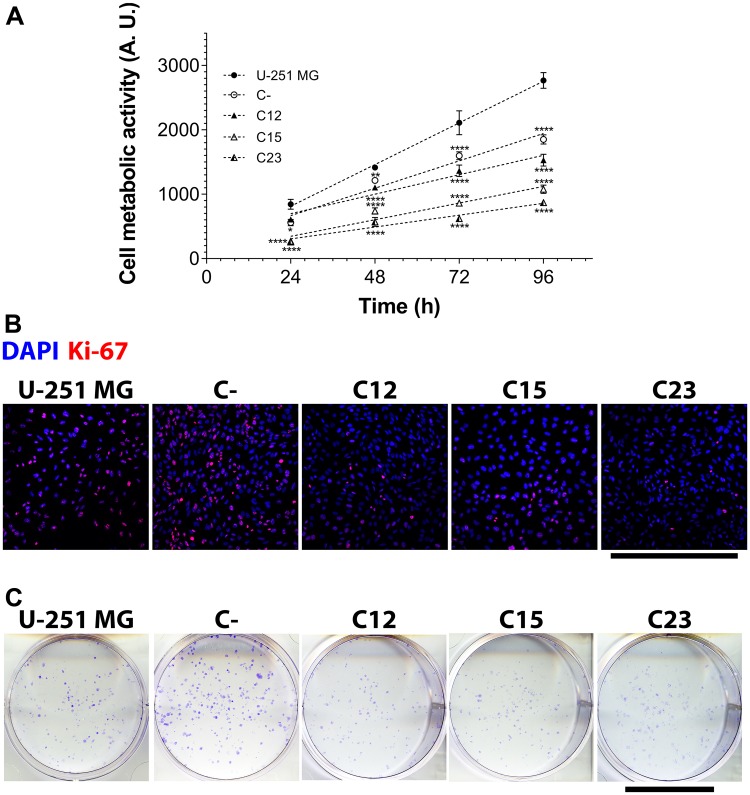
Figure 2. Cell metabolic activity, proliferation, and clonogenicity assays to assess GPC1 effects in GBM cells.
The experiments were performed in U-251 MG, C- (both control cell lines) and C12, C15, and C23 GPC1 knocked-down cell lines. (A) The metabolic activity assay included reaction with MTT to obtain a growth curve by assessing cell metabolic activity at 24, 48, 72, and 96 h. Linear regression was done, and the obtained parameters are exhibited in Supplementary Table 1. Data are plotted as mean ± SEM, in which the sample size was n = 14. The two-way ANOVA with Dunnett’s post-hoc test was performed, and significant comparison are marked as follows: * p < 0.05; ** p < 0.01; and **** p < 0.0001 vs. U-251 MG. (B) Cells were immunolabeled with anti-Ki-67 antibody and additionally stained with DAPI for nuclear visualization to quantify proliferating cells (Ki-67+ cells). Images were obtained with a Leica TCS SP8 CARS confocal microscope. The scale bar refers to 500 µm. (C) To investigate whether the clonogenic potential was influenced by GPC1, 400 cells were plated in 6-well plates, incubated for eight mitotic cycles, and then stained with crystal violet. Only formations with more than 50 cells were considered colonies. The scale bar indicated 2 cm.

