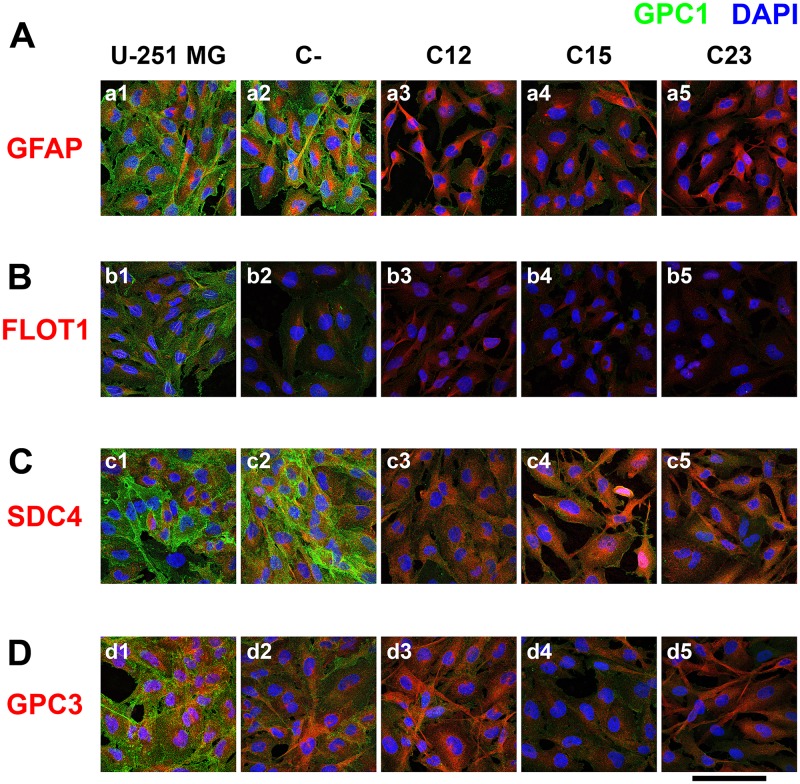
Figure 4. Confocal microscopy of immunolabeled GBM control and GPC1-silenced cells for a lipid raft marker or correlated HSPGs.
U-251 MG (1), C- (2), as controls cells, and C12 (3), C15, (4) and C23 (5) GPC1-depleted cells were immunolabeled for GPC1, in green, and different other antigens, in red, such as (A) GFAP, (B) FLOT1, (C) SDC4, and (D) GPC3. The cells’ nuclei were stained with DAPI, shown in blue. The images were obtained with a Leica TCS SP8 CARS confocal microscope. The scale bar refers to 100 µm.

