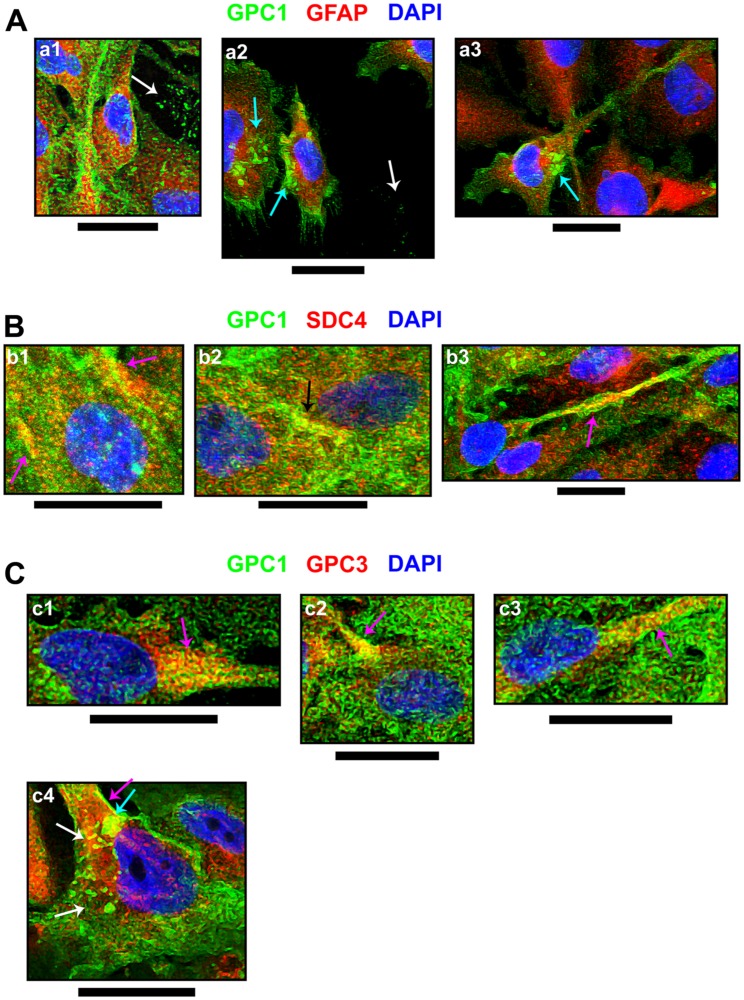
Figure 5. Cellular events indicating GPC1 and its association with SDC4 or GPC3.
From immunofluorescence assays, through confocal microscopy, special events including (A) GPC1 and its co-localization with (B) SDC4 or (C) GPC3, both in red, were imaged. GPC1 is always represented in green, and DAPI staining for cells’ nuclei is in blue. Images were obtained from U-251 MG cells (b2, b3 and c1-c4) or C- (a1-a3 and b1) as there was evident GPC1 expression in these cell lines. Arrows have the following color code: detection in extracellular vesicles (white); extracellular vesicles’ interaction with the cellular membrane (cyan); co-localization in the cell membrane (magenta); co-localization in cell-cell junctions (black). The images were obtained with a Leica TCS SP8 CARS confocal microscope. All scale bars refer to 25 µm.

