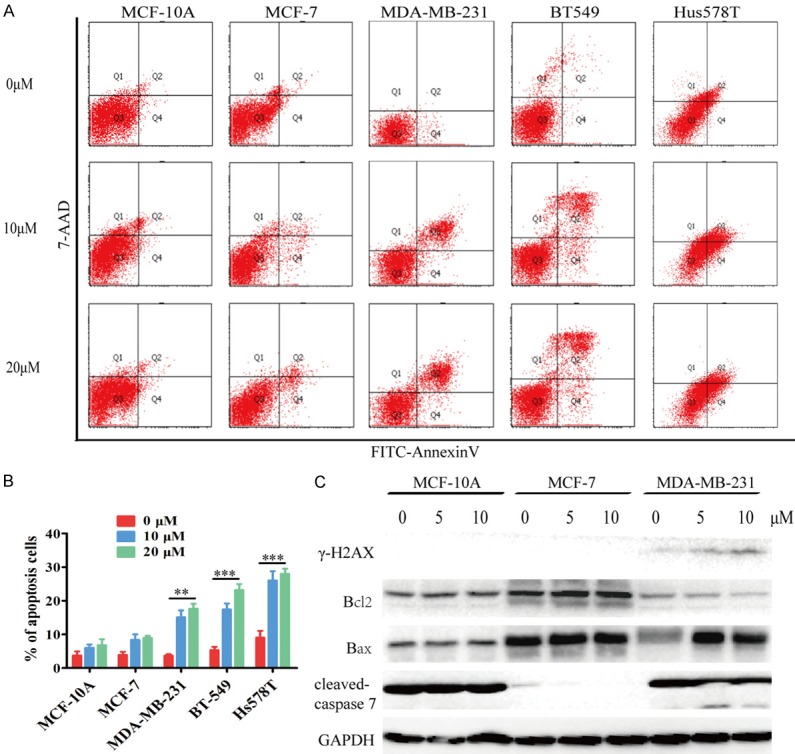
Figure 2.

TFT induces the apoptosis of TNBC cells. MCF-10A, MCF-7, MDA-MB-231, BT-549 and Hs578T cells were treated in triplicate with vehicle (control) or the indicated doses of TFT for 48 h. A. The percentages of apoptotic cells were determined by flow cytometry. B. Statistical analysis of the frequency of apoptotic cells. C. Immunoblot analysis of the relative expression levels of apoptotic regulators. Data are representative flow cytometry charts, images or expressed as the mean ± SEM of each group of cells. **P<0.01, ***P<0.001 vs. the control.
