Figure 3.

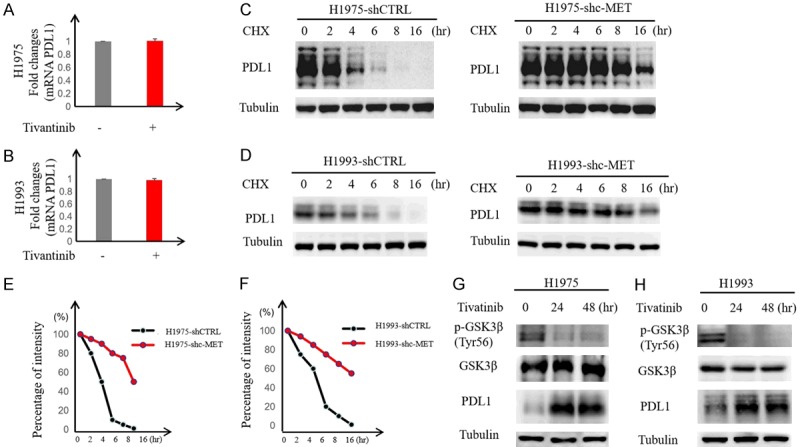
c-MET inhibition enhances PD-L1 expression by suppressing GSK3β. A and B. H1975 and H1993 cells were treated with tivantinib (1 μM) for 24 hours followed by RT-PCR to measure PD-L1 mRNA levels. Relative fold ratio of PD-L1 mRNA levels is shown. C and D. H1975 and H1993 shc-MET cells were treated with 20 mM cycloheximide (CHX) at the indicated intervals and subjected to Western blot analysis to evaluate PD-L1 expression levels. E and F. Quantification of PD-L1 half-life in the indicated groups. G and H. H1975 and H1993 cells were treated with tivantinib followed by Western blot analysis with the indicated antibodies. Tubulin served as loading control.
