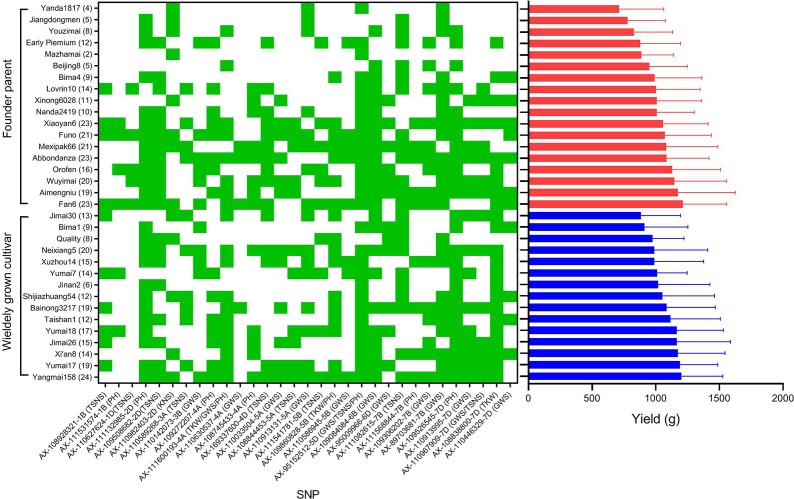
Figure 7.
The distribution of superior alleles in widely grown cultivars and founder parents and the variation of yield. Green indicates the distribution of favorable alleles, red and blue histogram represent the mean yield of 18 founder parents and 15 widely grown cultivars, respectively. The number of favorable alleles for each cultivar is in parentheses.

