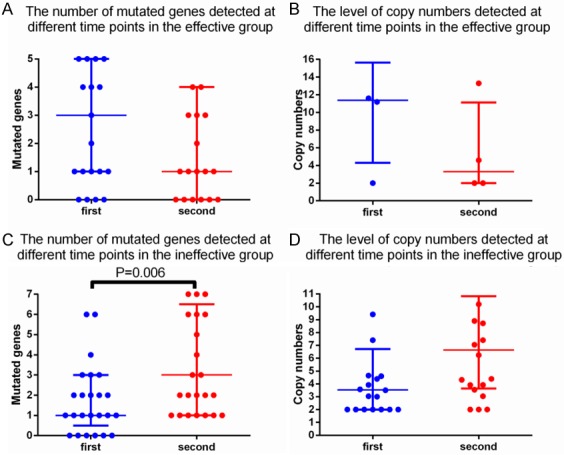
Figure 3.

Changes in gene mutations and copy number changes in different therapeutic effects groups. A. Changes in the number of mutant genes at different detection points in the effective group; B. Changes in the level of copy number at different detection points in the effective group; C. Changes in the number of mutant genes at different detection points in the ineffective group; D. Changes in the level of copy number at different detection points in the ineffective group.
