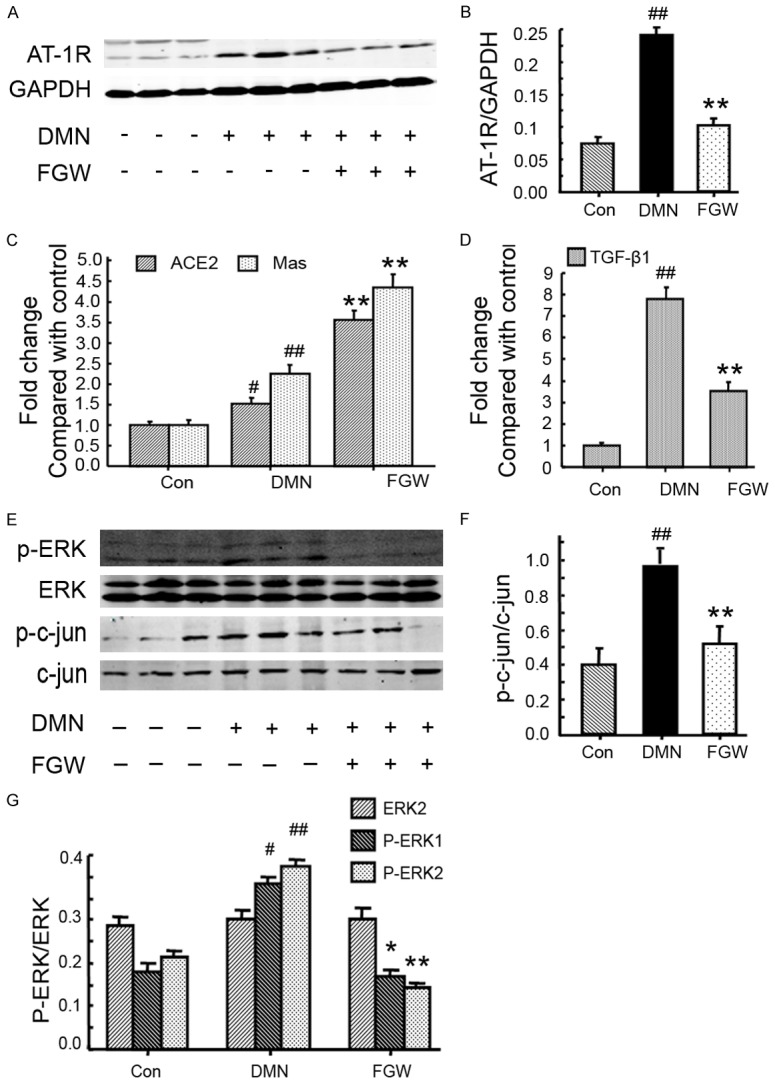
Figure 4.

FGW modulated expressions of AT1R, ERK and c-jun in liver tissues of hepatic fibrosis rat. A. Western blot bands for AT-1R expression. B. Statistical analysis for AT-1R expression. C. Statistical analysis for ACE2 and Mas mRNA expression. D. Statistical analysis for TGF-β1 mRNA expression. E. Western blot bands for p-ERK, ERK, p-c-Jun and c-Jun expression. F. Statistical analysis for p-c-Jun expression. G. Statistical analysis for p-ERK expression. ##P < 0.01 vs. Control group. **P < 0.01 vs. DMN group.
