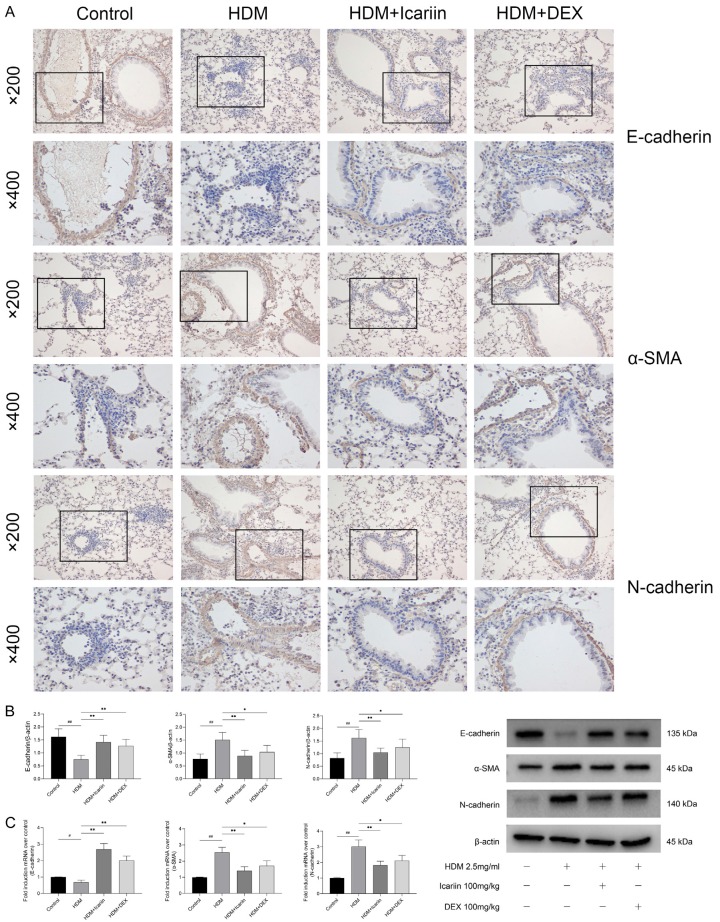
Figure 7.
The impact of Icariin on E-cadherin, α-SMA, and N-cadherin expression in HDM-exposed mice. A. Expression of E-cadherin, α-SMA, and N-cadherin in lung tissue were determined by Immunohistochemical staining, and images were obtained with a microscope (upper panel ×200 and lower panel ×400). B. Expression of E-cadherin, α-SMA, and N-cadherin in lung tissue were detected by western blot and data were expressed as fold change in protein expression normalized to β-actin expression. C. Expression of E-cadherin, α-SMA, and N-cadherin mRNA in lung tissue were detected by quantitative real-time PCR and data were expressed as fold change in mRNA expression normalized to GAPDH expression, with respect to the control group. #P<0.05, ##P<0.01 versus control group, *P<0.05, **P<0.01 versus TGF-β1 group.

