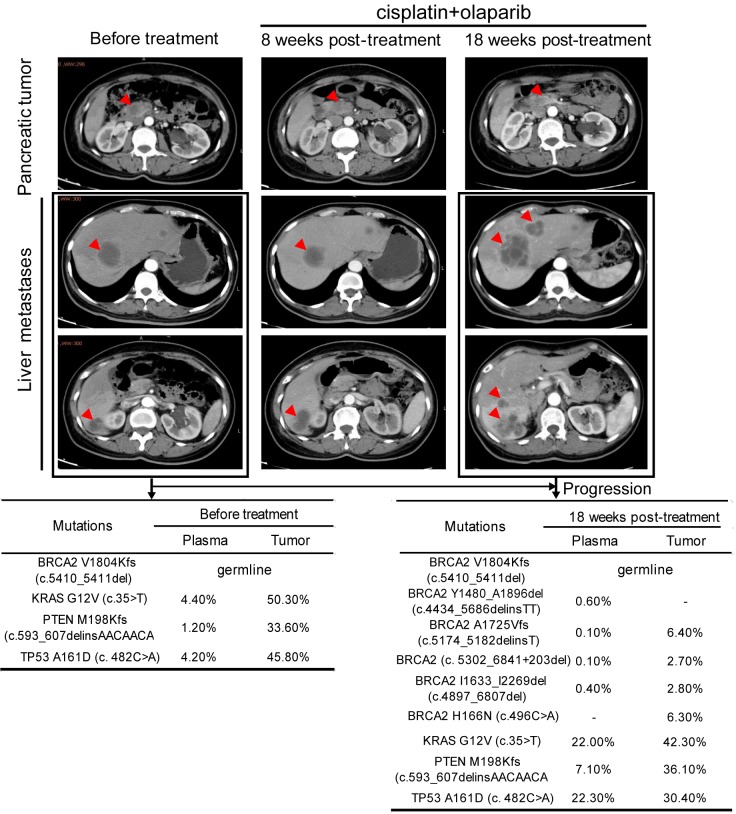
Figure 1.
Disease diagnosis and progression during treatment course with genetic testing results. Upper panel, CT images of the abdomen and pelvis showed the disease progression during treatment. Tumor lesions are indicated by red arrows in pancreas and liver. Lower panel, NGS-based genetic testing results for tissue and plasma biopsies collected before and 18 weeks after treatment. Mutant allele frequency (MAF) of each mutation was shown as percentage in the table. -: not detected.

