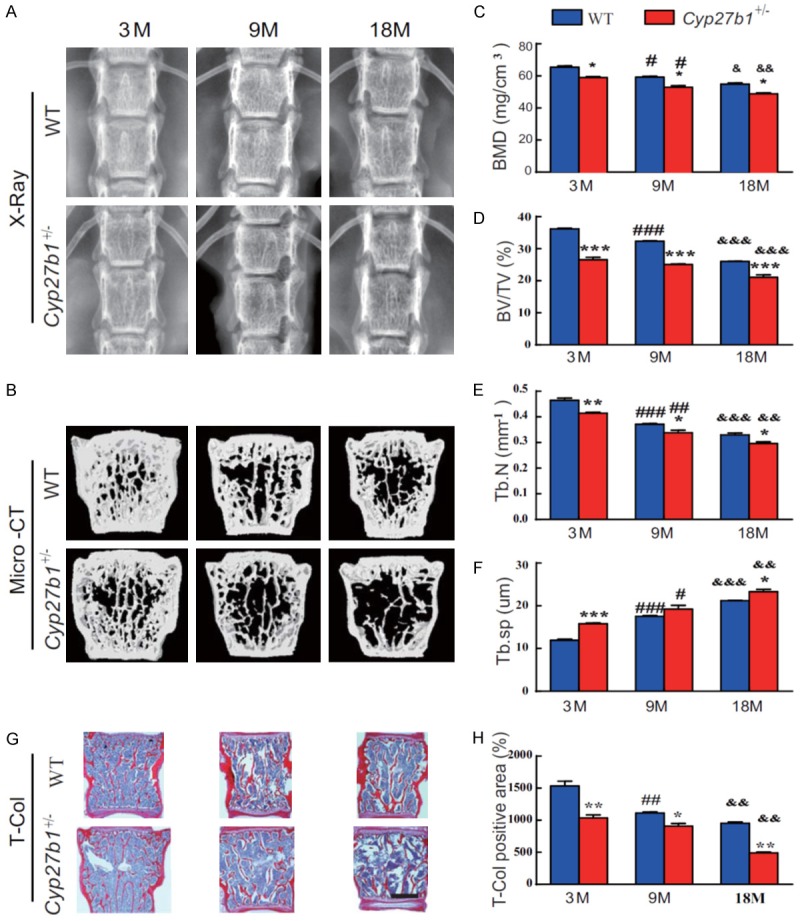
Figure 1.

1,25(OH)2D insufficiency accelerates age-related bone loss. (A) Representative radiographs and (B) three-dimensional reconstruction of Micro-CT scan images of vertebrae from 3-, 9- and 18-month-old Cyp27b1 +/- mice and wild-type (WT) mice. Quantitative analysis of (C) bone mineral density (BMD), (D) the bone mass parameter, bone volume relative to tissue volume (BV/TV), (E) the bone microstructural parameter, trabecular number (Tb.N) and (F) the bone microstructural parameter, trabecular separation (Tb.Sp). (G) Representative micrographs of first lumbar vertebral sections stained histochemically for total collagen (T-Col). (H) The percentage of T-Col-positive area relative to total bone tissue. Values are means ± SEM of 6 determinations per group. ***P<0.001, **P<0.01, *P<0.05, compared with age-matched WT mice age. ###P<0.001, ##P<0.01, #P<0.05, Compared with genotype-matched 3-month-old mice. &&&P<0.001, &&P<0.01, &P<0.05, compared with genotype-matched 9-month-old mice.
