
Figure 3.
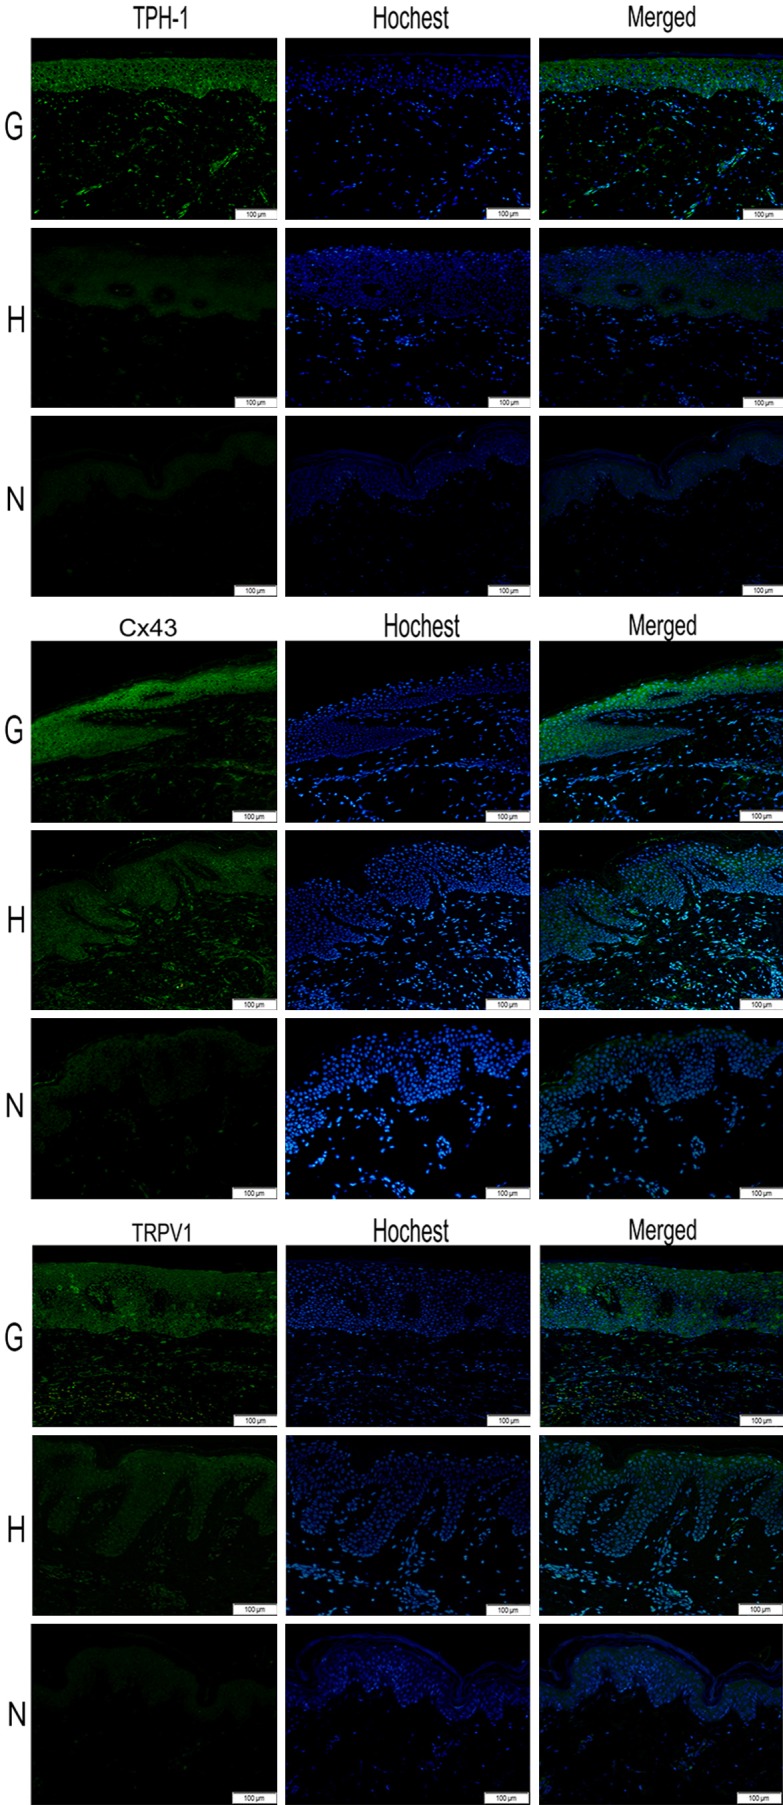
Images (200×) of immunofluorescence staining for all factors. Green areas represent tissue with high expression of target protein (TPH1, Cx43 and TRPV1), while blue areas represent nucleus DNA (Hochest). The expression of TPH1, Cx43 and TRPV1 was highest in the G group among three groups, while after receiving hyperbaric oxygen therapy, the expression of TPH1, Cx43 and TRPV1 were decreased in H group. N group nearly not expressed target protein. (G: keloid sample from patients without HBO therapy; H: keloid sample from patient with HBO therapy; N: normal skin sample).