Figure 3.
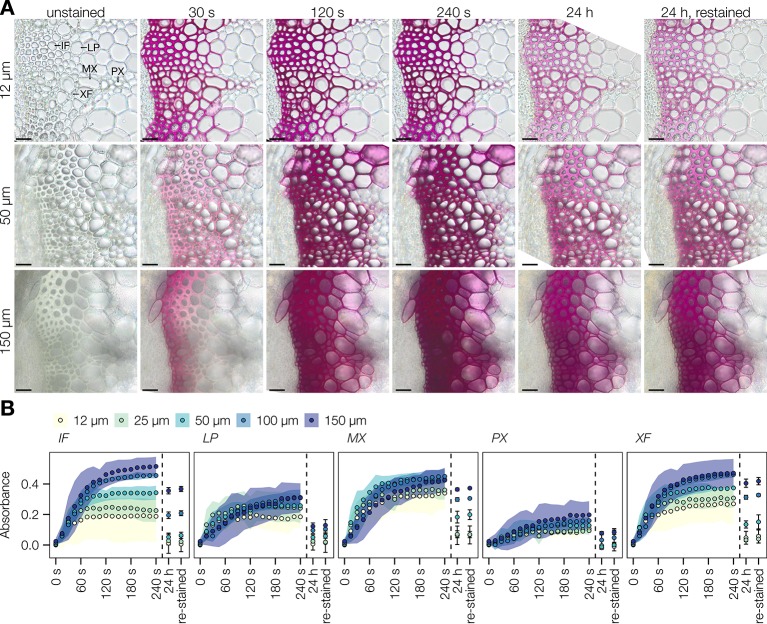
Stability of the Wiesner test in plant sections. (A) Live imaging of Arabidopsis transverse stem sections before, during, and after staining with the Wiesner test. Different section thicknesses, ranging from 12 to 150 µm, were followed for 24 h, and re-stained with addition of new Wiesner test reagent. Lignified cell types include interfascicular fibers (IF), lignified parenchyma (LP), metaxylem vessels (MX), protoxylem vessels (PX), and xylary fibers (XF). Bars = 25 µm. (B) Changes in absorbance in response to the Wiesner test monitored by live imaging in the five different cell types during the first 240 s after staining, after 24 h, and after re-staining. Colored ribbons and bars indicate ± standard deviation. Measurements were done using 50 measurement points of 12 pixels each per cell type in five independent plants.

