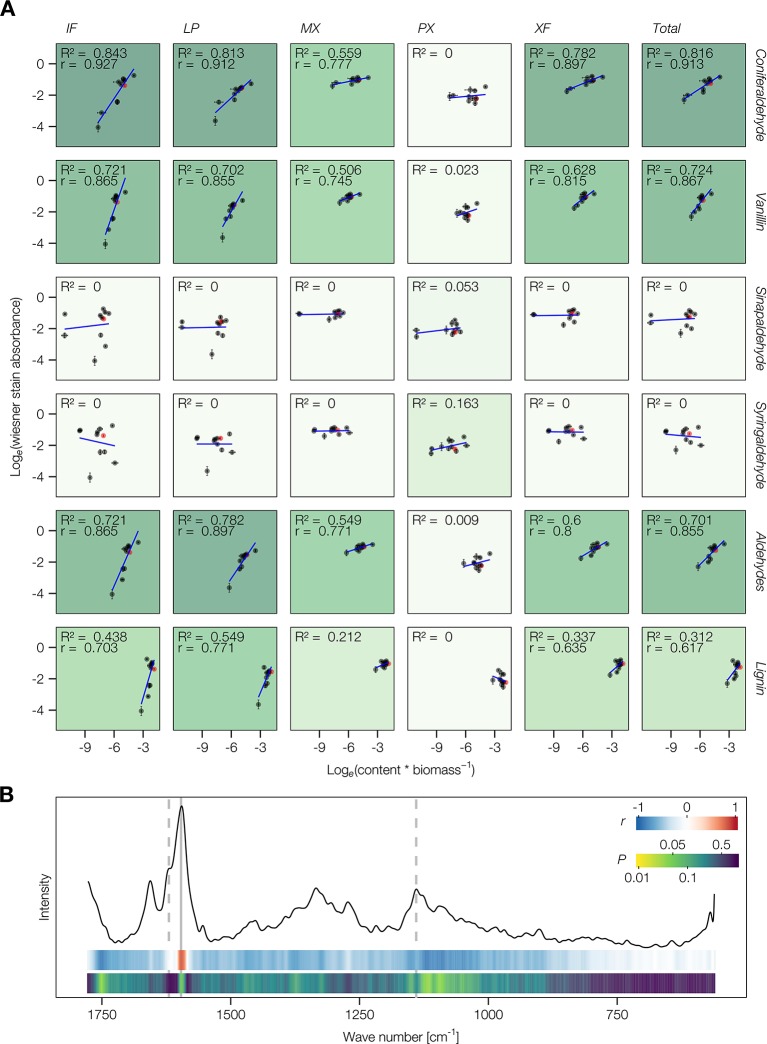
Figure 4.
Quantitative aspect of the Wiesner test on lignin or its monomers. (A) Correlation analysis between the absorbance of different cell types stained by the Wiesner test and the relative content of lignin aldehydes, G or S C6C3 or C6C1 measured by pyrolysis/GC–MS. ‘Total' refers to the average across cell types weighted according to their proportional area contribution. Wild type (WT) is indicated in red. The explained variance (R 2) is indicated by the intensity of the green background and the Pearson correlation coefficient r is shown where its P < 0.05. (B) Comparison between the absorbance of cells stained by the Wiesner test and the microspectra obtained using Raman confocal microspectroscopy for IF, MX, and XF in WT and 4cl1x4cl2 mutant plants. Representative Raman microspectra of a WT metaxylem vessel cell wall is presented together with color coded ribbons showing the strength and P-value of the Pearson correlation between Raman intensity and Wiesner test absorbance for each wave number.

