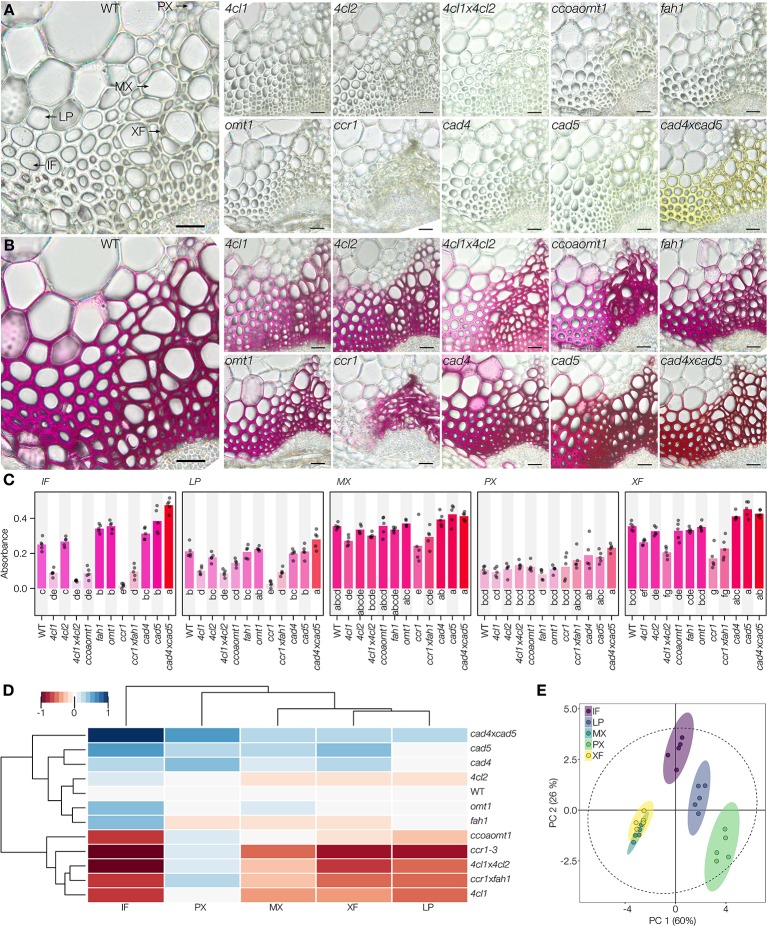
Figure 5.
Reaction of the Wiesner test on genetically modified lignin in Arabidopsis. (A, B) 50 µm sections of the different genotypes before (A) and after (B) staining. Lignified cell types include interfascicular fibers (IF), lignified parenchyma (LP), metaxylem vessels (MX), protoxylem vessels (PX), and xylary fibers (XF). Bars = 25 µm. (C) Changes in absorbance in response to the Wiesner test monitored in the five different cell types for the different genotypes. Circles indicate the average of each individual replicate and bars represent the average per genotype. Quantification was done on 50 measurement points of 12 pixels each per cell type in five independent plants. The color of bars reflects the respective average color of the stain. Letters indicate significant differences according to a Tukey-HSD test (per panel; confidence limit α = 0.05). (D) Hierarchical clustering of the Wiesner test absorbance in the five lignified cell types in 12 genotypes using the range normalized Euclidean distance of their average difference from the WT. (E) Principal component analysis of the five lignified cell types according to their absorbance in the 12 tested genotypes; 95% data ellipses are indicated.

