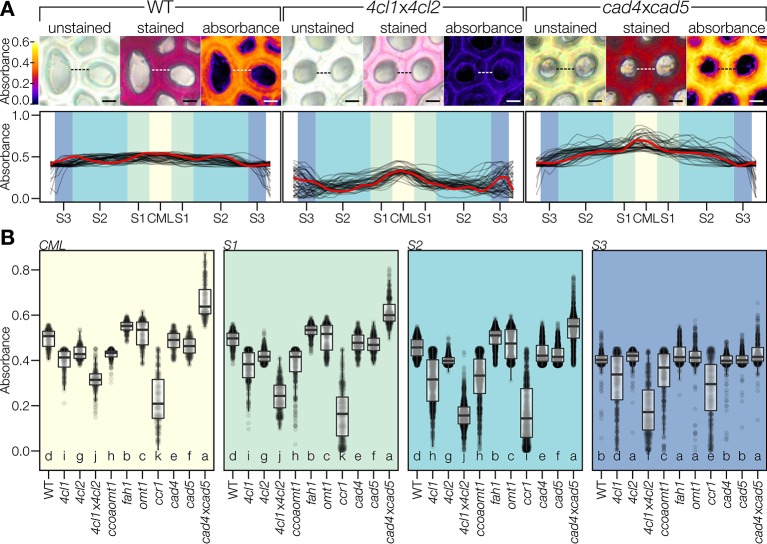
Figure 7.
Coniferaldehyde content varies across cell wall layers. (A) Color coded absorbance maps created by subtracting unstained absorbance from stained absorbance. Line profiles across the cell walls separating two adjacent interfascicular fiber cells revealed the relative changes in coniferaldehyde incorporation between genotypes; such as in the coniferaldehyde-reduced mutant 4cl1x4cl2 and the coniferaldehyde over-accumulating mutant cad4xcad5 compared to the WT. Scale bar = 5 µm. Quantification was done on 50 line profiles from two plants per genotype. The profile indicated by the dashed line in the pictures is drawn in red in the line profiles. Cell wall layers, including middle lamella (CML) and secondary cell wall layers S1–S3, are indicated by different background shading. (B) Coniferaldehyde incorporation in each cell wall layer. Each data point reflects one pixel in a line profile. Statistically significant differences between genotypes are indicated by different letters (per panel; Kruskal–Wallis test, Holm-adjusted for multiple comparisons, α = 0.05).

