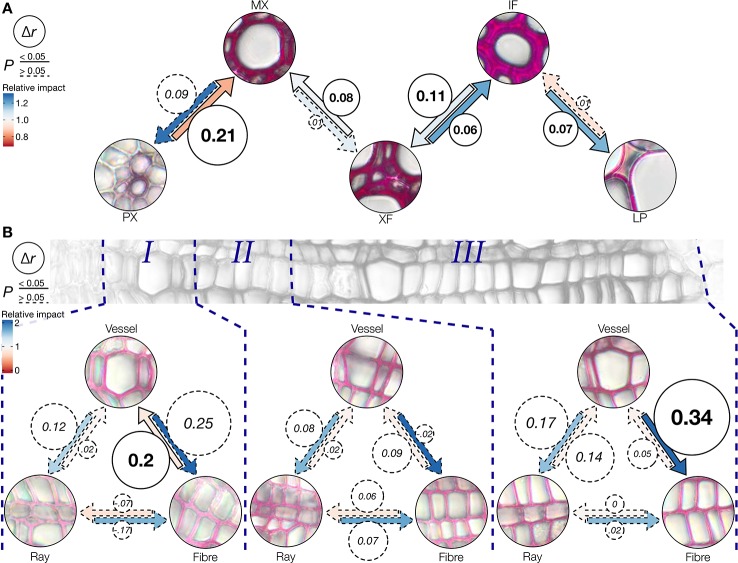
Figure 8.
Effect of neighboring cell types on coniferaldehyde incorporation. (A) Schematic representation of the effect of neighboring cells on the accumulation of coniferaldehyde in specific cell types in 11 Arabidopsis WT and LOF lines (underlying correlations are shown in Figure S10 ). Δr is shown in circles and coded in circle area and represents the changes in the Pearson correlation coefficient when the cell type at the tip of the arrow is directly adjacent to the cell type at base of the arrow. Statistically significant (William's test, α = 0.05) Δr values are indicated by continuous arrow and circle outlines. The color of the arrows represents the relative impact (fold change in absorbance) on the cell type at the tip of the arrow when adjacent to the cell type at the base of the arrow. (B) Cell type-specific effects of adjacent cell types to the response to the Wiesner test in three genotypes of poplar along xylem development. Δr, significance, and relative impact are coded analogous to panel (A).

