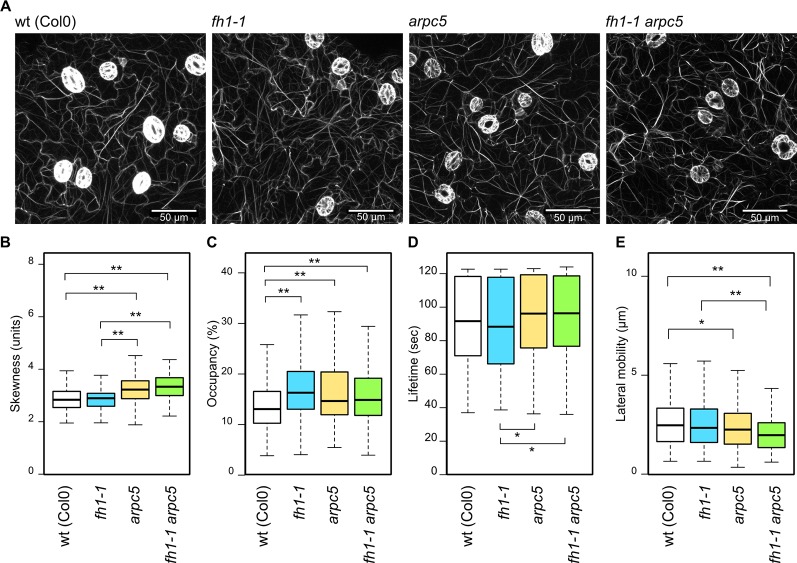
Figure 3.
Actin cytoskeleton organization and dynamics in the adaxial cotyledon epidermis of 5 days after germination (DAG) actin nucleator mutants expressing Lifeact-GFP. (A) Representative images of microfilament organization in wt, fh1-1, arpc5-1, and fh1-1 arpc5-1 seedlings. (B) Quantitative estimate of actin bundling, measured as skewness of fluorescence intensity distribution among labeled structures. (C) Quantitative estimate of actin network density, measured as pixel occupancy of skeletonized meshwork. (D) Microfilament structure lifetime, represented by maximum values observed over 120 s in structures crossing a 20 µm transect. (E) Microfilament structure lateral mobility, represented by maximum trajectories observed over 120 s in structures crossing a 20 µm transect. Statistical significance of differences is denoted by asterisks (* for p < 0.05, ** for p < 0.01).

