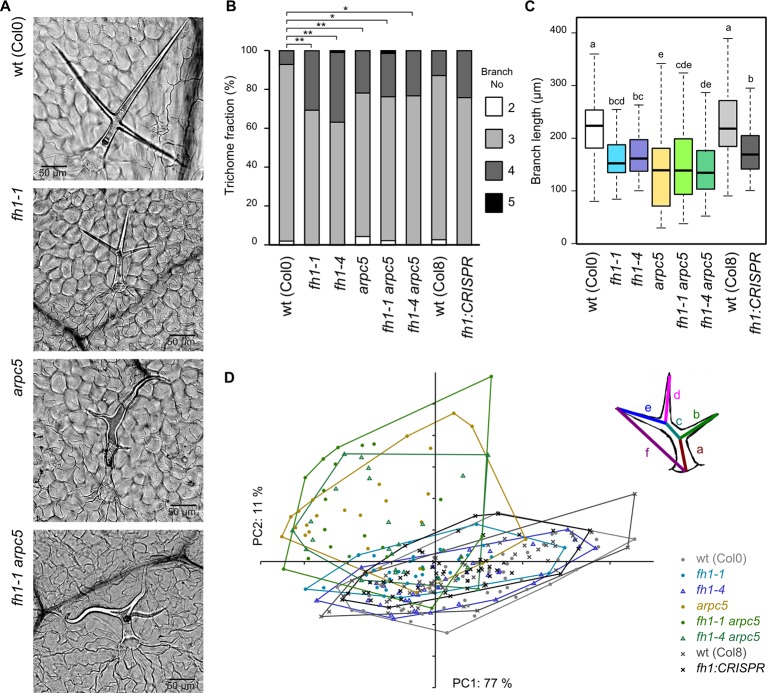
Figure 7.
Trichome shape in wt plants and actin nucleator mutants. (A) Typical trichomes of wt, fh1-1, arpc5-1, and fh1-1 arpc5-1 plants. (B) Distribution of trichome branch numbers. Statistical significance of between-genotype differences is denoted by asterisks (* for p < 0.05, **for p < 0.01). (C) Length of terminal branches in three-branched trichomes. Values labeled by the same letters do not differ significantly (p < 0.05). (D) Scatter plot of principal component analysis (PCA) results for six length parameters (a–f, see inset for definition) describing the three-branched trichome shape and size, shown at an arbitrary scale.

