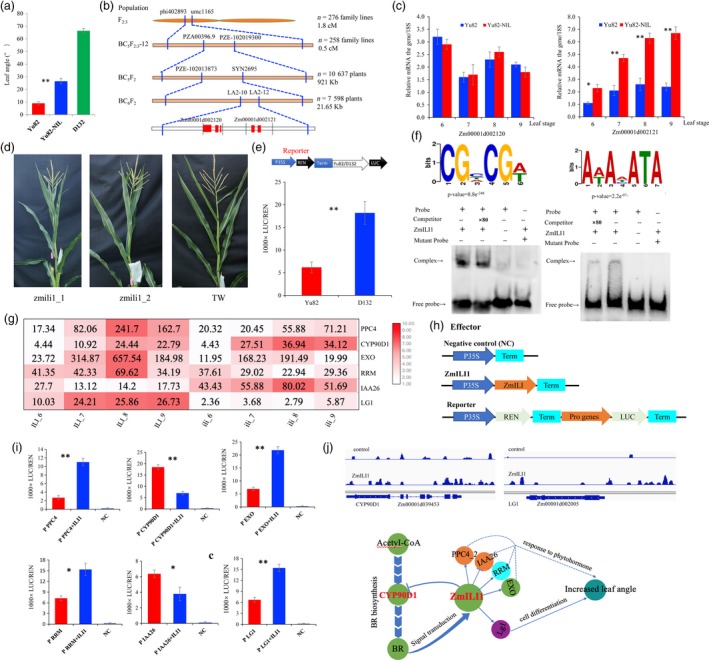
Figure 1.

ZmILI1 functional mechanism for LA formation in maize. (a) The mean LA statistics for all leaves above the uppermost ear (n = 10, **P < 0.01). (b) Sequential fine mapping of ZmILI1. The red square boxes represent exons in the genes. (c) The expression profiles of the two candidate genes in the limited region (*P < 0.05, **P < 0.01). (d) CRISPR knockout lines of Zmili1 showing reduced LA. (e) The upper panel shows the promoter region of a diagram of the construct used for the promoter activity assay. The lower panel shows the constructs that were introduced into N benthamiana leaves; the expression levels were determined using the Luc activity assay (**P < 0.01). (f) ZmILI1 binding to the CGNCGN and ANANATA core motifs (upper panel); EMSA results confirming the in vitro binding of ZmILI1 to CGTCGA and AAACATA (lower panel). (g) Heat map showing the differentially expressed genes bound by ZmILI1. (h) The 35S:REN‐Pro PR:LUC reporter constructs were transiently expressed in N. benthamiana leaves together with control vector or 35S:ZmILI1 effector. (i) The LUC/REN ratio represents the relative activity of the gene promoters (*P < 0.05, **P < 0.01). (j) Two‐target gene binding peaks for the positive control genes are shown in the Integrated Genome Brower (upper panel); a schematic model for LA formation in maize (lower panel). The arrows between the genes stand for promotion or activation, and the T bars between the genes indicate suppression. The orange circles represent auxin‐responsive genes; the cyan circle represents cytokinin‐responsive gene; the green circles represent brassinosteroid‐responsive genes; and the purple circles represent cell differentiation genes.
