
Figure 4.
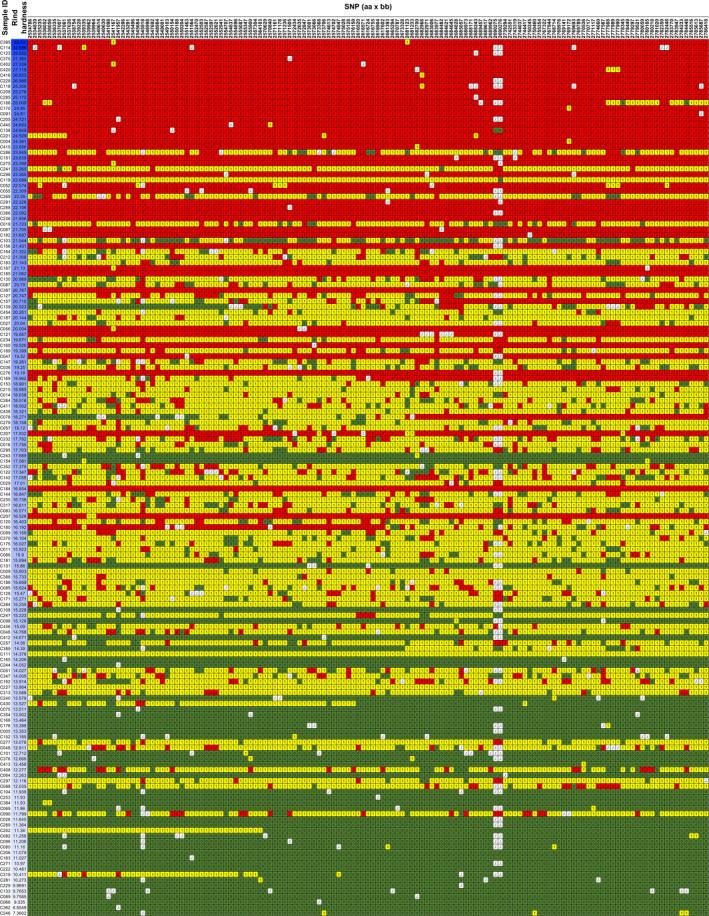
The visible data of SNPs in the target region. The haplotype of the 159 F2 individuals. Red indicates homozygous P‐a, green indicates homozygous P‐b, while yellow indicates heterozygous. The blue colour depth represents the rind hardness. The SNP data of individuals were arranged from top to bottom according to descending order of rind hardness values.