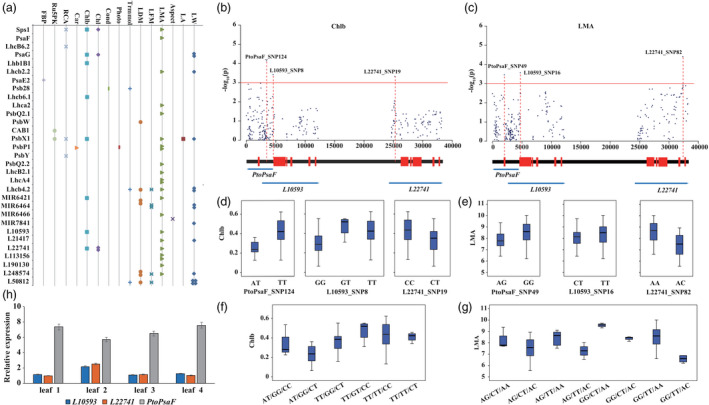
Figure 2.

Allelic loci within photosynthetic genes across the coexpression network significantly affecting photosynthetic efficiency. (a) Scatterplot of significant SNP‐trait associations via single SNP‐based associations (P < 0.001). The points represent traits, and multiple points indicate that several SNPs are associated with the same gene. The x‐axis represents traits, and the y‐axis represents genes. (b) Manhattan plot for Chlb content showing PtoPsaF and its regulatory lncRNAs (L10593 and L22741). Genes are shown at the bottom (red rectangles, transcribed sequences; black lines, nontranscribed sequences). (c) Genotype effects of each causal SNP from PtoPsaF and its regulatory lncRNAs for Chlb content. (d) Six possible genotype combinations with a frequency of ≥5% from the three allelic variations, and the effects of genotype combinations on Chlb content in the association population of P. tomentosa. The SNPs in each genotype combination are shown in order according to (c). (e) Manhattan plot for LMA showing PtoPsaF and its regulatory lncRNAs (L10593 and L22741). (f) Genotype effects of each causal SNP from PtoPsaF and its regulatory lncRNAs for LMA. (g) Eight possible genotype combinations with a frequency of ≥5% from the three allelic variations and the effects of genotype combinations on LMA. The SNPs in each genotype combination are shown in order according to (f). (h) The expression patterns of L10593, L22741, and PtoPsaF in four tissues of P. tomentosa.
