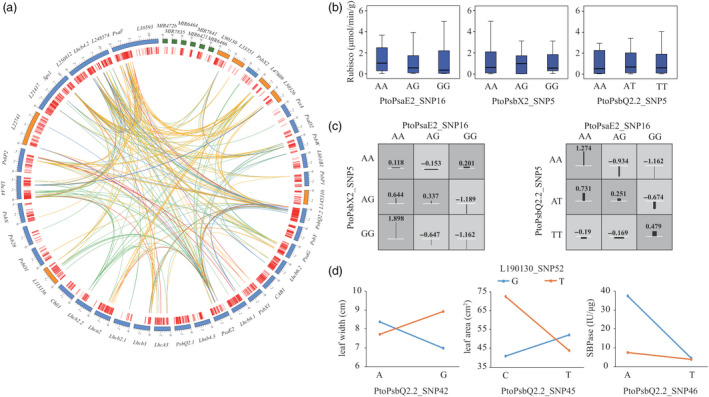
Figure 3.

Allelic interactions between significant pairwise SNPs within candidate genes related to the photosynthetic coexpression network. (a) Circos plot showing 511 pairwise interactions for photosynthesis‐related traits (P ≤ 0.001). The outer circle represents the PEGs (blue), lncRNAs (orange) and miRNAs (green). The middle circle indicates the positions of the SNPs (red). The interior lines represent the pairwise interactions underlying five categories of traits; the coloured lines represent different categories (orange, red, dark blue, light blue and light green indicate leaf size, leaf mass, photosynthetic characters, pigment content and enzyme activity, respectively). (b) Box plots showing the single SNP genotype effects of PtoPasE2_SNP16 with two loci in PtoPsbX2 and PtoPsbQ2.2 for Rubisco activity, and (c) The epistatic effects of different genotypic combinations for Rubisco activity. (d) The epistatic effects for leaf width between L190130_SNP52 with three loci in PtoPsbQ2.2.
