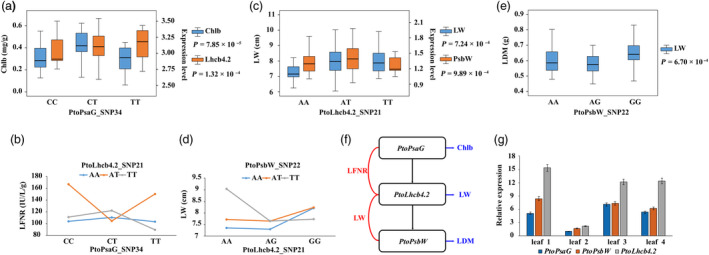
Figure 4.

Integration of epistasis and eQTN analysis identifies the important components involved in the photosynthetic pathway. (a) Box plot for the Chlb trait (blue) and PtoLhcb4.2 expression (orange) plotted as an effect of genotype at PtoPsaG_SNP34. (b) Pairwise interactions between PtoPsaG_SNP34 and PtoLhcb4.2_SNP21 control the LFNR trait with different genotypic combinations at the two loci. (c) Box plot for the LW trait (blue) and PtoPsbW expression (orange) plotted as an effect of genotype at PtoLhcb4.2_SNP21. (d) Pairwise interactions between PtoLhcb4.2_SNP21 and PtoPsbW_SNP22 control the LFNR trait with different genotypic combinations at the two loci. (e) Box plot for the LDM trait (blue) plotted as an effect of genotype at PtoPsbW_SNP22. (f) The genetic regulatory network of PsaG‐Lhcb4.2‐PsbW constructed based on the epistasis and eQTN mapping data. The horizontal blue arrows represent the genes associated with photosynthetic traits via a single SNP‐based association; the vertical black arrows represent the regulatory relationships of eQTNs; the red curves indicate the epistatic interactions of genes underlying complex traits. (g) The expression patterns of PtoPsaG, PtoLhcb4.2 and PtoPsbW in four tissues and organs of P. tomentosa.
