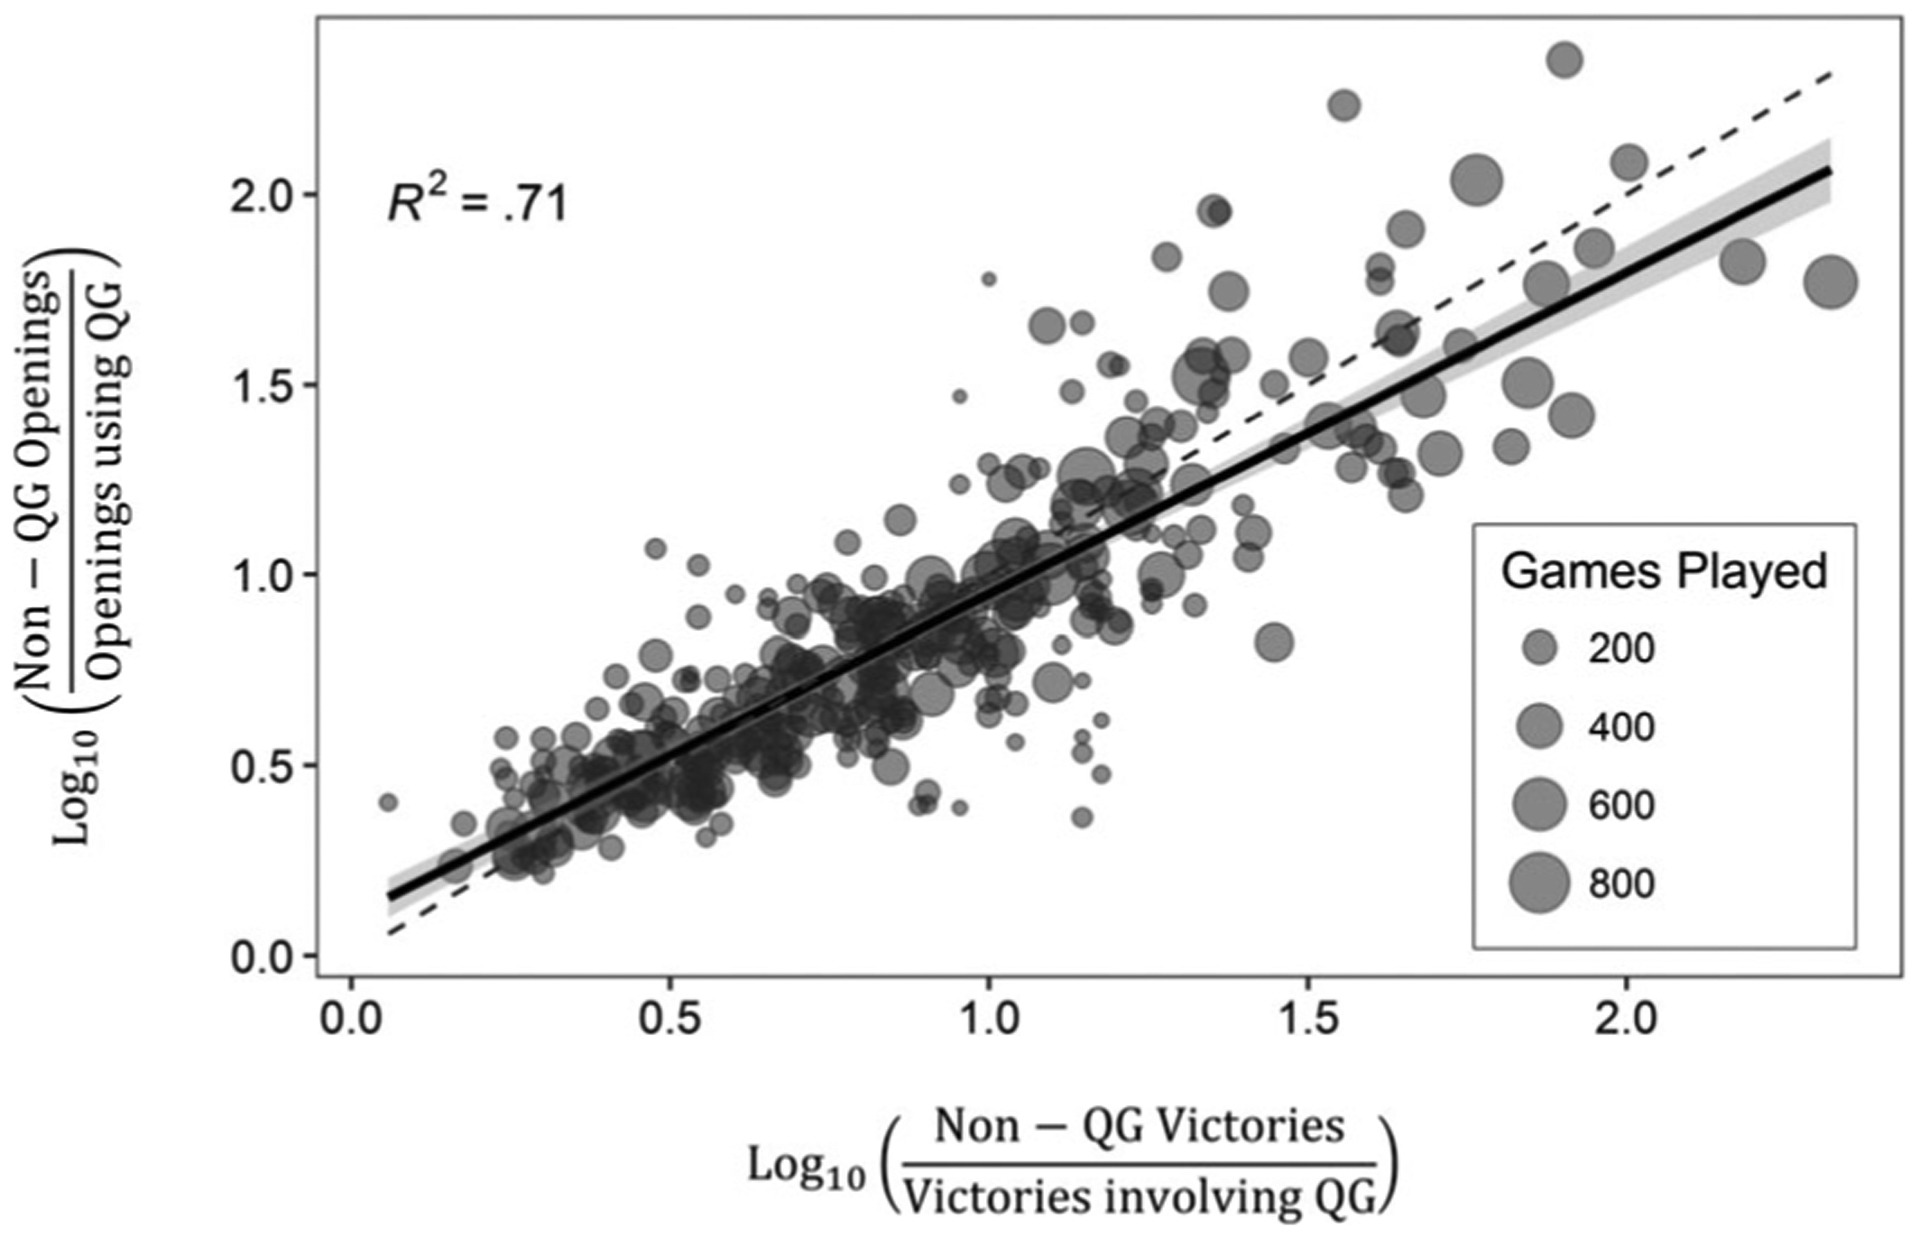
Figure 2.

White’s opening chess moves conform to the generalized matching law (GML). Points represent White players. The size of each point grows in proportion to the number of games completed by the player in the database. Vertical axis represents the ratio of each player’s non-Queens Gambit (QG) openings to QG openings (log10 scale); horizontal axis represents the ratio of victories each player accrued through non-QG openings relative to QG openings (log10 scale). The dashed line represents theoretically perfect conformity to the GML; the solid line represents the line of best fit to the data (estimated using Ordinary Least Squares). The shaded ribbon around the line of best fit represents the 95% confidence interval for the slope of that line. R2 is the proportion variance explained by the line of best fit.
