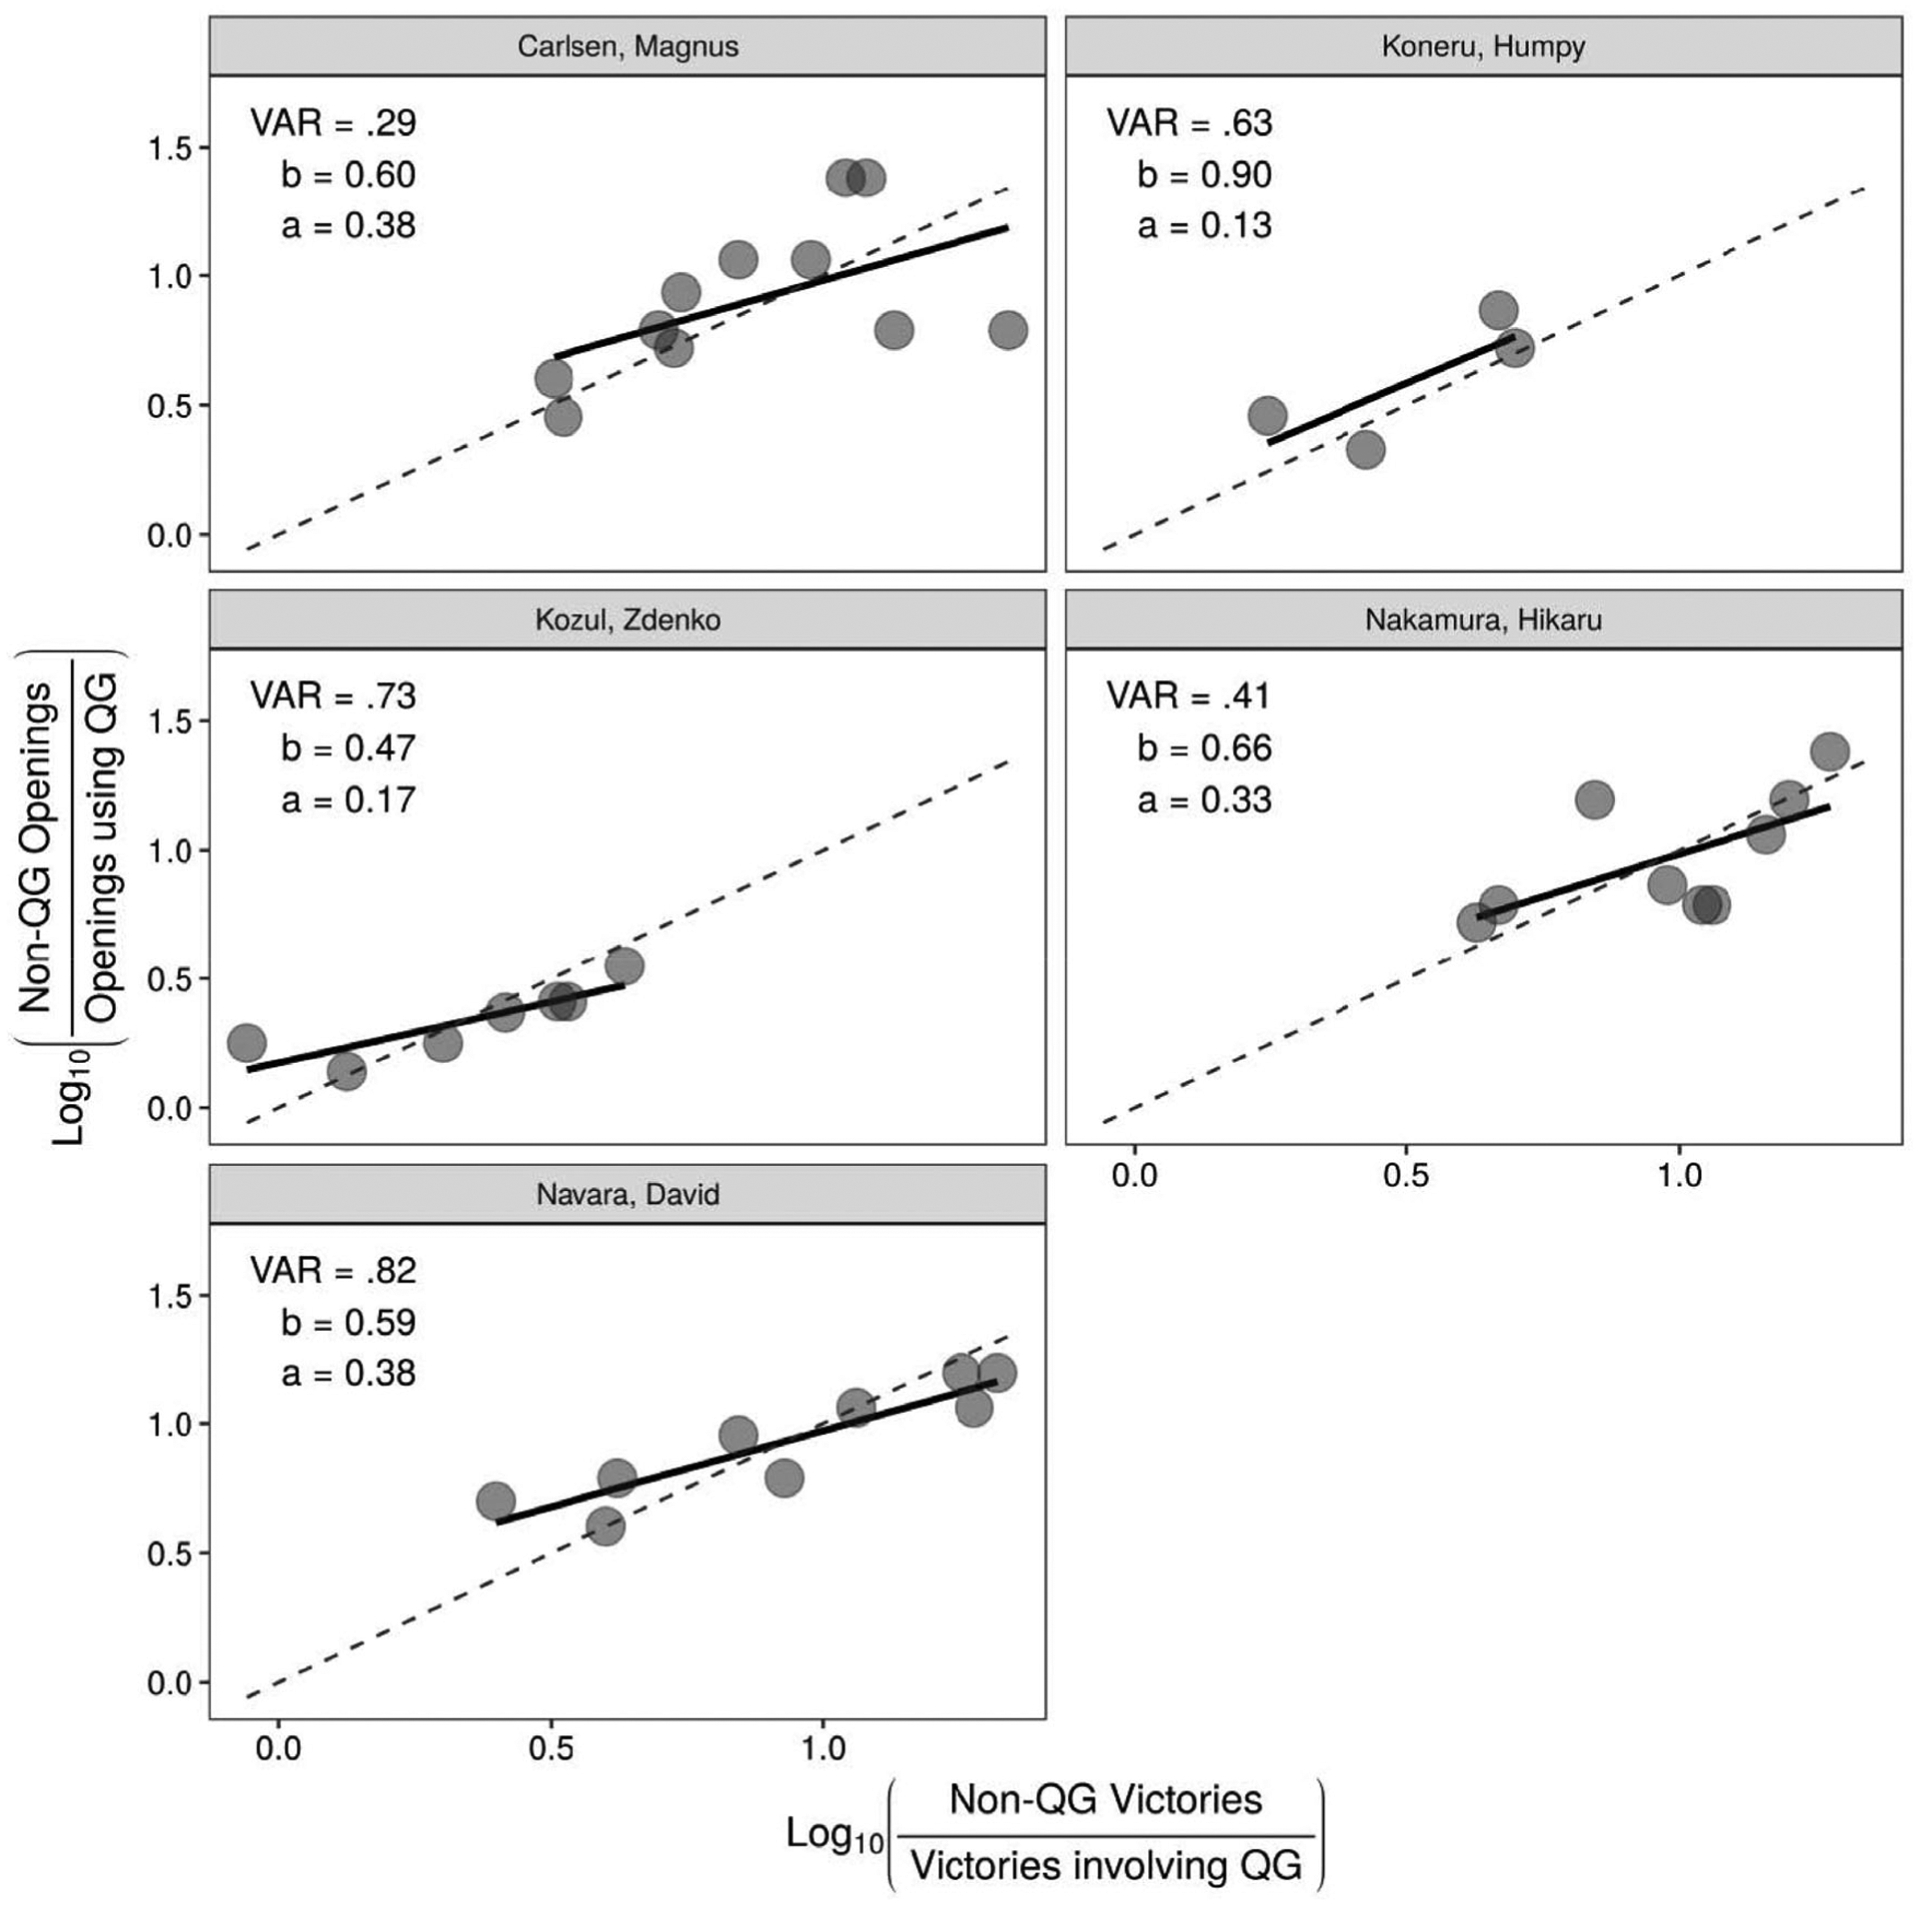
Figure 3.

Selected players’ individual matching performance. Each point represents a 50-game block of a player’s recorded history in the dataset. The horizontal axis represents the log-10 ratio of Non-QG victories to QG victories for White in each block. The vertical axis represents the log-10 ratio of Non-QG openings to openings in which White offered the QG. The dashed lines represent theoretically “perfect” matching. Solid lines represent regression slopes for each individual player. Note that because these points are arrayed relative to QG offers and victories, they do not depict a temporal sequence (i.e., moving farther right does not indicate a later game block). VAR = variance explained, b = sensitivity (regression slope), a = bias (regression intercept).
